 |
| Market Cap | 3.68B | EPS (ttm) | -2.07 |
| P/E | - | EPS this Y | 79.26% |
| Forward P/E | 235.88 | EPS next Y | 111.59% |
| PEG | - | EPS past 5Y | - |
| P/S | 40.21 | EPS next 5Y | - |
| P/B | - | EPS Q/Q | 19.59% |
| Dividend | - | Sales Q/Q | 123.78% |
| Insider Own | 80.75% | Inst Own | 7.33% |
| Insider Trans | 0.00% | Inst Trans | 8.84% |
| Short Float | 0.46% | Earnings | May 21/a |
| Analyst Recom | 2.00 | Target Price | 20.75 |
| Avg Volume | 229.43K | 52W Range | 6.70 - 18.00 |
|
|
|
|
Alvotech is a biotechnology company, which engages in the development and manufacture of biosimilar medicines. The firm is focusing on the development of its product candidates. It operates through the following geographical segments: Europe, North America, Asia, and Other. The company was founded by Robert Vilhelm Wessman in 2013 and is headquartered in Luxembourg. |
|
 |
 |
| Market Cap | 61.60M | EPS (ttm) | -1.05 |
| P/E | - | EPS this Y | 3268.62% |
| Forward P/E | 2.87 | EPS next Y | 89.40% |
| PEG | - | EPS past 5Y | - |
| P/S | 1.29 | EPS next 5Y | - |
| P/B | 0.57 | EPS Q/Q | -94.27% |
| Dividend | - | Sales Q/Q | 5.17% |
| Insider Own | 53.98% | Inst Own | 4.44% |
| Insider Trans | 0.00% | Inst Trans | -74.76% |
| Short Float | 0.02% | Earnings | May 21/a |
| Analyst Recom | 1.00 | Target Price | 30.00 |
| Avg Volume | 8.50K | 52W Range | 13.42 - 23.98 |
|
|
|
|
Eurodry Ltd. engages in the provision of worldwide ocean-going transportation services. It owns and operates drybulk carriers that transport major bulks, such as iron ore, coal and grains, and minor bulks, which includes bauxite, phosphate, and fertilizers. The company was founded on January 8, 2018 and is headquartered in Athens, Greece. |
|
|
 |
| Market Cap | 5.27B | EPS (ttm) | 4.24 |
| P/E | 23.79 | EPS this Y | 66.26% |
| Forward P/E | 26.50 | EPS next Y | 17.52% |
| PEG | 0.70 | EPS past 5Y | 46.19% |
| P/S | 2.18 | EPS next 5Y | 34.00% |
| P/B | 7.25 | EPS Q/Q | 80.22% |
| Dividend | - | Sales Q/Q | 0.25% |
| Insider Own | 2.46% | Inst Own | 98.61% |
| Insider Trans | -13.92% | Inst Trans | 2.03% |
| Short Float | 4.42% | Earnings | May 21/a |
| Analyst Recom | 1.33 | Target Price | 93.95 |
| Avg Volume | 937.12K | 52W Range | 19.53 - 109.53 |
|
|
|
|
Modine Manufacturing Co. engages in the provision of thermal management products and solutions. It operates through the Climate Solutions and Performance Technologies business segments. The Climate Solutions segment provides climate-controlled solutions and components, heat transfer products, heating, ventilating, air conditioning and refrigeration products, and data center cooling solutions. The Performance Technologies segment designs and manufactures air- and liquid-cooled technology for vehicular, stationary power, and industrial applications. In addition, the Performance Technologies segment provides thermal solutions to zero-emission and hybrid commercial vehicle and automotive customers, and coating products and application services. The company was founded by Arthur B. Modine on June 23, 1916 and is headquartered in Racine, WI. |
| Insider Trading |
Relationship |
Date |
Transaction |
Cost |
#Shares |
Value ($) |
#Shares Total |
SEC Form 4 |
| Agen Brian Jon | VP, Human Resources | Mar 28 '24 | Option Exercise | 11.34 | 16,799 | 190,489 | 119,208 | Apr 01 06:38 PM | | Agen Brian Jon | VP, Human Resources | Mar 28 '24 | Sale | 95.64 | 16,799 | 1,606,584 | 102,409 | Apr 01 06:38 PM | | Wilson David J. | Director | Mar 18 '24 | Sale | 89.22 | 8,000 | 713,768 | 6,109 | Mar 19 04:28 PM | | Patterson Christopher William | Director | Mar 07 '24 | Sale | 90.56 | 14,225 | 1,288,243 | 97,517 | Mar 08 03:50 PM | | Lucareli Michael B | EVP, CFO | Feb 29 '24 | Option Exercise | 9.41 | 82,312 | 774,640 | 276,899 | Mar 04 12:57 PM |
|
|
| |
 |
| Market Cap | 53.50M | EPS (ttm) | 2.95 |
| P/E | 1.73 | EPS this Y | -62.93% |
| Forward P/E | - | EPS next Y | - |
| PEG | - | EPS past 5Y | - |
| P/S | 1.18 | EPS next 5Y | - |
| P/B | 0.56 | EPS Q/Q | 243.07% |
| Dividend | - | Sales Q/Q | -27.91% |
| Insider Own | 53.44% | Inst Own | 1.57% |
| Insider Trans | 0.00% | Inst Trans | 23.00% |
| Short Float | 1.01% | Earnings | May 21/a |
| Analyst Recom | 1.00 | Target Price | 10.00 |
| Avg Volume | 34.05K | 52W Range | 3.25 - 5.47 |
|
|
|
|
Pyxis Tankers, Inc. is an international maritime transportation holding company, which engages in the ownership and operation of a fleet of product tankers. It also deals with the seaborne transportation and shipping of refined petroleum products and other bulk liquids. It operates through the Tanker Vessels and Dry-bulk Vessels segments. The company was founded by Valentios Valentis on March 23, 2015 and is headquartered in Maroussi, Greece. |
|
|
 |
| Market Cap | 4.45B | EPS (ttm) | 3.49 |
| P/E | 22.04 | EPS this Y | -54.36% |
| Forward P/E | 23.95 | EPS next Y | 0.61% |
| PEG | 13.77 | EPS past 5Y | 126.86% |
| P/S | 2.25 | EPS next 5Y | 1.60% |
| P/B | 3.12 | EPS Q/Q | -44.02% |
| Dividend | - | Sales Q/Q | -3.93% |
| Insider Own | 2.83% | Inst Own | 102.27% |
| Insider Trans | -1.24% | Inst Trans | -1.16% |
| Short Float | 2.90% | Earnings | May 21/a |
| Analyst Recom | 2.57 | Target Price | 79.00 |
| Avg Volume | 243.74K | 52W Range | 52.12 - 86.71 |
|
|
|
|
Skyline Champion Corp. engages in the manufacturing and retail of mobile homes and other manufactured housing. It builds homes under the following brands: Skyline Homes, Champion Home Builders, Athens Park Model RVs, Dutch Housing, Excel Homes, Homes of Merit, New Era, Redman Homes, Shore Park, Silvercrest, Titan Homes in the U.S. and Moduline, and SRI Homes in western Canada. It operates through the following business segments: U.S. Factory-Built Housing, Canadian Factory-Built Housing, and Corporate and Other. The U.S. Factory-Built Housing segment includes manufacturing and retail housing operations. The Canadian Factory-Built Housing segments relates to selling houses. The Corporate and Other segment refers to the company's transportation operations, corporate costs directly incurred for all segments and intersegment eliminations. The company was founded in 1959 and is headquartered in Troy, MI. |
| Insider Trading |
Relationship |
Date |
Transaction |
Cost |
#Shares |
Value ($) |
#Shares Total |
SEC Form 4 |
| Anderson Keith A | Director | Dec 15 '23 | Option Exercise | 15.00 | 18,750 | 281,250 | 256,848 | Dec 18 03:13 PM | | Anderson Keith A | Director | Dec 15 '23 | Sale | 73.00 | 18,750 | 1,368,750 | 238,098 | Dec 18 03:13 PM | | Berman Michael B | Director | Dec 14 '23 | Sale | 72.47 | 1,698 | 123,054 | 0 | Dec 18 03:13 PM | | Burkhardt Timothy A. | VP & Controller | Sep 14 '23 | Sale | 71.04 | 4,113 | 292,194 | 34,855 | Sep 18 11:13 AM | | Anderson Keith A | Director | Sep 01 '23 | Option Exercise | 15.00 | 5,000 | 75,000 | 243,098 | Sep 06 11:25 AM |
|
|
| |
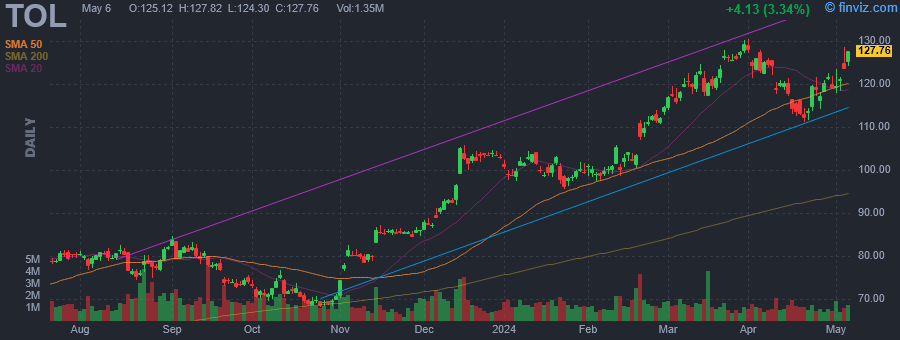 |
| Market Cap | 13.58B | EPS (ttm) | 12.95 |
| P/E | 10.06 | EPS this Y | 11.39% |
| Forward P/E | 9.49 | EPS next Y | -0.23% |
| PEG | - | EPS past 5Y | 20.57% |
| P/S | 1.34 | EPS next 5Y | -0.05% |
| P/B | 1.94 | EPS Q/Q | 32.22% |
| Dividend | 0.68% | Sales Q/Q | 9.42% |
| Insider Own | 1.13% | Inst Own | 89.98% |
| Insider Trans | -13.45% | Inst Trans | -3.88% |
| Short Float | 2.94% | Earnings | May 21/a |
| Analyst Recom | 2.00 | Target Price | 133.50 |
| Avg Volume | 1.30M | 52W Range | 63.34 - 135.37 |
|
|
|
|
Toll Brothers, Inc. engages in the design, building, marketing, and arranging of financing for detached and attached homes in residential communities. It operates through the following geographical segments: North Region, Mid-Atlantic Region, South Region, Mountain Region, and Pacific Region. The company was founded by Robert I. Toll, and Bruce E. Toll in May 1967 and is headquartered in Fort Washington, PA. |
| Insider Trading |
Relationship |
Date |
Transaction |
Cost |
#Shares |
Value ($) |
#Shares Total |
SEC Form 4 |
| East Stephen F. | Director | Apr 15 '24 | Sale | 119.32 | 1,500 | 178,980 | 9,389 | Apr 15 04:07 PM | | SHAPIRO PAUL E | Director | Apr 03 '24 | Sale | 123.22 | 2,500 | 308,050 | 120,107 | Apr 03 04:20 PM | | Connor Martin P. | Chief Financial Officer | Mar 20 '24 | Sale | 123.90 | 5,000 | 619,500 | 44,721 | Mar 21 04:05 PM | | Yearley Douglas C. Jr. | Chief Executive Officer | Mar 04 '24 | Option Exercise | 32.85 | 50,000 | 1,642,500 | 396,382 | Mar 05 04:03 PM | | Yearley Douglas C. Jr. | Chief Executive Officer | Mar 04 '24 | Sale | 118.85 | 50,000 | 5,942,601 | 346,382 | Mar 05 04:03 PM |
|
|
|
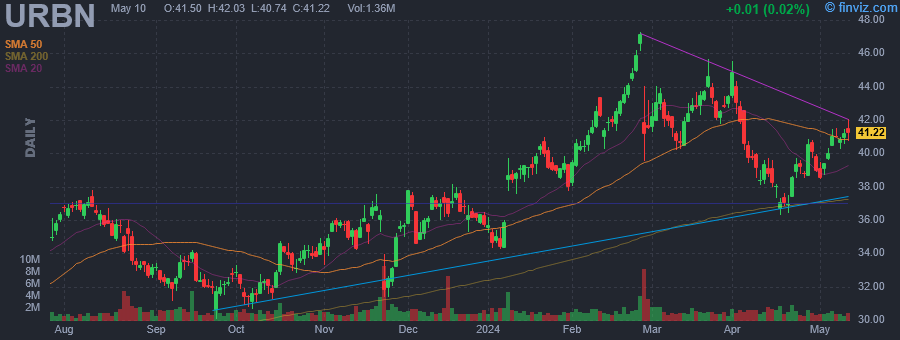 |
| Market Cap | 3.85B | EPS (ttm) | 3.05 |
| P/E | 13.51 | EPS this Y | 10.16% |
| Forward P/E | 10.60 | EPS next Y | 8.58% |
| PEG | 0.49 | EPS past 5Y | 2.34% |
| P/S | 0.75 | EPS next 5Y | 27.50% |
| P/B | 1.81 | EPS Q/Q | 49.87% |
| Dividend | - | Sales Q/Q | 7.34% |
| Insider Own | 36.98% | Inst Own | 72.48% |
| Insider Trans | -0.24% | Inst Trans | -2.68% |
| Short Float | 6.53% | Earnings | May 21/a |
| Analyst Recom | 2.80 | Target Price | 44.58 |
| Avg Volume | 1.73M | 52W Range | 26.45 - 47.29 |
|
|
|
|
Urban Outfitters, Inc. engages in the operation of a general consumer product retail and wholesale business selling to customers through various channels including retail locations, websites, catalogs, and mobile applications. It operates through the following segments: Retail, Wholesale and Subscription. The Retail segment contains the Anthropologie, BHLDN, Free People, Terrain, and Urban Outfitters brands and its Food and Beverage division. The Wholesale segment designs, develops, and markets apparel, intimates, active wear, and home goods under the Free People, Anthropologie, and Urban Outfitters brands. The Subscription segment consists of the Nuuly brand, which is a monthly women's apparel subscription rental service. The company was founded by Richard A. Hayne and Scott A. Belair in 1970 and is headquartered at Philadelphia, PA. |
| Insider Trading |
Relationship |
Date |
Transaction |
Cost |
#Shares |
Value ($) |
#Shares Total |
SEC Form 4 |
| Smith Tricia D | Global CEO Anthropologie Group | Mar 12 '24 | Sale | 40.74 | 6,250 | 254,625 | 6,353 | Mar 13 05:01 PM | | Marein-Efron Melanie | Chief Financial Officer | Mar 12 '24 | Sale | 40.72 | 6,000 | 244,290 | 908 | Mar 13 05:02 PM | | Hayne Azeez | Chief Administrative Officer | Mar 12 '24 | Sale | 41.00 | 2,878 | 117,998 | 0 | Mar 13 05:01 PM | | Hayne Azeez | Chief Administrative Officer | Mar 11 '24 | Sale | 40.75 | 2,878 | 117,278 | 2,878 | Mar 12 05:06 PM | | Marein-Efron Melanie | Chief Financial Officer | Mar 08 '24 | Sale | 42.23 | 3,345 | 141,259 | 6,908 | Mar 12 05:08 PM |
|
|
| |
 |
| Market Cap | 2.38B | EPS (ttm) | -14.03 |
| P/E | - | EPS this Y | -73483.23% |
| Forward P/E | 10.59 | EPS next Y | 124.34% |
| PEG | - | EPS past 5Y | -45.85% |
| P/S | 0.63 | EPS next 5Y | - |
| P/B | 0.47 | EPS Q/Q | -79.30% |
| Dividend | - | Sales Q/Q | 73.24% |
| Insider Own | 21.87% | Inst Own | 76.91% |
| Insider Trans | -0.00% | Inst Trans | 0.81% |
| Short Float | 12.57% | Earnings | May 21/a |
| Analyst Recom | 2.00 | Target Price | 31.16 |
| Avg Volume | 1.12M | 52W Range | 15.02 - 47.35 |
|
|
|
|
ViaSat, Inc. engages in providing communications technologies and services. It operates through the following business segments: Satellite Services, Commercial Networks, and Government Systems. The Satellite Services segment provides satellite-based high-speed broadband services with multiple applications to consumers, enterprises, and mobile broadband customers. The Commercial Networks segment develops and produces a variety of advanced satellite and wireless products, systems, and solutions that enable the provision of high-speed fixed and mobile broadband services. The Government Systems segment offers global mobile broadband services to military, and government users and develops and produces network-centric Internet Protocol (IP)-based fixed and mobile secure communications products and solutions. The company was founded by Mark D. Dankberg and Mark J. Miller on May 1, 1986 and is headquartered in Carlsbad, CA. |
| Insider Trading |
Relationship |
Date |
Transaction |
Cost |
#Shares |
Value ($) |
#Shares Total |
SEC Form 4 |
| Gowrappan Kumara Guru | President | May 13 '24 | Option Exercise | 0.00 | 53,075 | 0 | 54,398 | May 14 05:15 PM | | Bridenstine James Frederick | Director | Mar 31 '24 | Option Exercise | 0.00 | 1,000 | 0 | 1,000 | Apr 01 05:36 PM | | Miller Craig Andrew | Pres. Global Space Networks | Jan 05 '24 | Sale | 26.83 | 150 | 4,024 | 13,248 | Jan 09 04:21 PM | | Miller Craig Andrew | Pres. Global Space Networks | Dec 06 '23 | Sale | 22.53 | 150 | 3,380 | 13,398 | Dec 07 04:08 PM | | Miller Craig Andrew | Pres. Global Space Networks | Nov 17 '23 | Option Exercise | 0.00 | 6,619 | 0 | 15,839 | Nov 21 04:26 PM |
|
|
|
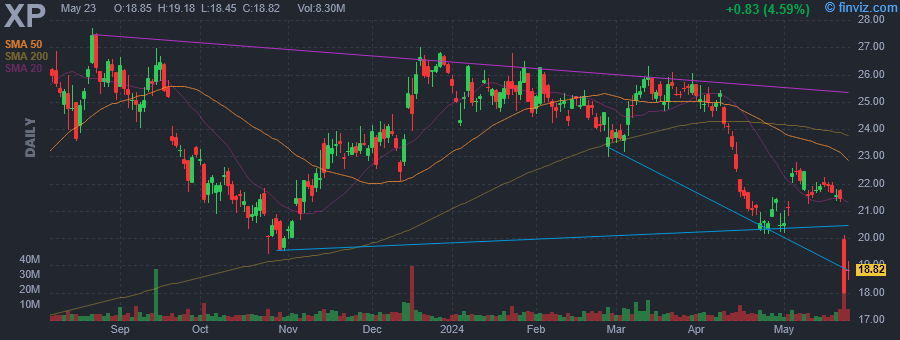 |
| Market Cap | 11.74B | EPS (ttm) | 1.44 |
| P/E | 14.90 | EPS this Y | 12.56% |
| Forward P/E | 10.86 | EPS next Y | 16.47% |
| PEG | 1.09 | EPS past 5Y | 44.60% |
| P/S | 3.88 | EPS next 5Y | 13.70% |
| P/B | 2.93 | EPS Q/Q | 43.68% |
| Dividend | 3.11% | Sales Q/Q | 26.65% |
| Insider Own | 35.50% | Inst Own | 53.79% |
| Insider Trans | 0.00% | Inst Trans | -1.59% |
| Short Float | 3.27% | Earnings | May 21/a |
| Analyst Recom | 1.55 | Target Price | 28.81 |
| Avg Volume | 5.34M | 52W Range | 17.25 - 27.71 |
|
|
|
|
XP, Inc. engages in the operation of technology-driven financial services platform. The firm provides customers with two principal types of offerings, financial advisory services for retail clients in Brazil, high-net-worth clients, international clients and corporate and institutional clients, and an open financial product platform providing access to over 800 investment products including equity and fixed income securities, mutual and hedge funds, structured products, life insurance, pension plans, real-estate investment funds (REITs) and others from XP, its partners and competitors. he company was founded by Guilherme Dias Fernandes Benchimol in 2001 and is headquartered in Vila Olimpia, Brazil. |
|
|
