 |
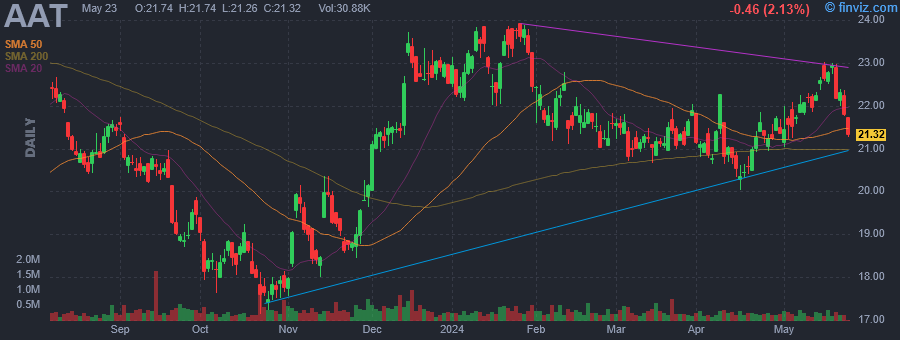
| Market Cap | 1.30B | EPS (ttm) | 0.84 |
| P/E | 25.50 | EPS this Y | -16.67% |
| Forward P/E | 29.25 | EPS next Y | 4.29% |
| PEG | - | EPS past 5Y | 14.84% |
| P/S | 2.95 | EPS next 5Y | - |
| P/B | 1.09 | EPS Q/Q | 37.85% |
| Dividend | 6.89% | Sales Q/Q | 6.12% |
| Insider Own | 24.30% | Inst Own | 77.05% |
| Insider Trans | 0.00% | Inst Trans | -1.80% |
| Short Float | 2.10% | Earnings | Apr 30/a |
| Analyst Recom | 3.25 | Target Price | 20.67 |
| Avg Volume | 298.62K | 52W Range | 17.06 - 23.92 |
|
|
|
|
American Assets Trust, Inc. is a real estate investment trust. It owns, operates, acquires, and develops retail shopping centers, office properties, mixed-use properties, and multifamily properties. It operates through the following segments: Office, Retail, Multifamily, and Mixed-Use. The Office segment includes rental of office space. The Retail segment focuses on rental of retail space. The Multifamily segment refers to rental of apartments. The Mixed-Use segment offers rental of retail space and other tenant services. The company was founded on July 16, 2010 and is headquartered in San Diego, CA. |
| Insider Trading |
Relationship |
Date |
Transaction |
Cost |
#Shares |
Value ($) |
#Shares Total |
SEC Form 4 |
| RADY ERNEST S | Chairman & CEO | May 12 '23 | Buy | 18.76 | 100,000 | 1,876,000 | 1,009,021 | May 12 04:25 PM | | RADY ERNEST S | Chairman & CEO | May 11 '23 | Buy | 18.84 | 47,540 | 895,654 | 909,021 | May 12 04:25 PM | | RADY ERNEST S | Chairman & CEO | May 10 '23 | Buy | 18.84 | 42,140 | 793,918 | 861,481 | May 10 04:51 PM | | RADY ERNEST S | Chairman & CEO | May 09 '23 | Buy | 18.86 | 100,000 | 1,886,000 | 819,341 | May 10 04:51 PM | | RADY ERNEST S | Chairman & CEO | May 08 '23 | Buy | 18.93 | 100,000 | 1,893,000 | 7,677,628 | May 10 04:51 PM |
|
|
 |
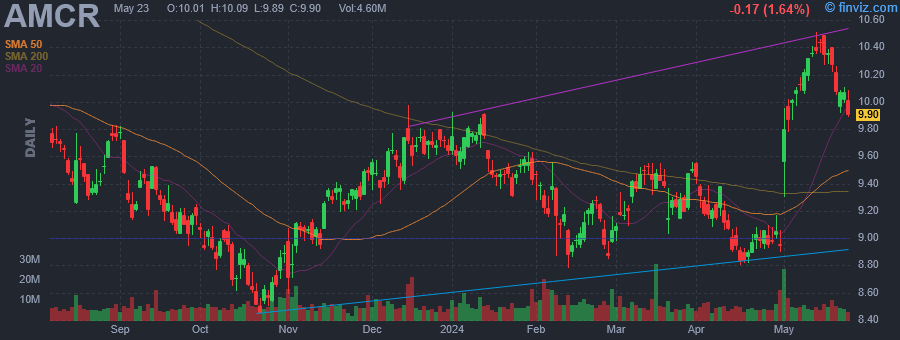 |
| Market Cap | 12.92B | EPS (ttm) | 0.44 |
| P/E | 20.31 | EPS this Y | -6.68% |
| Forward P/E | 12.22 | EPS next Y | 6.92% |
| PEG | 3.76 | EPS past 5Y | 7.36% |
| P/S | 0.92 | EPS next 5Y | 5.40% |
| P/B | 3.26 | EPS Q/Q | -69.91% |
| Dividend | 5.64% | Sales Q/Q | -10.73% |
| Insider Own | 0.35% | Inst Own | 53.01% |
| Insider Trans | -1.04% | Inst Trans | -0.83% |
| Short Float | 1.80% | Earnings | Apr 30/a |
| Analyst Recom | 2.86 | Target Price | 9.87 |
| Avg Volume | 8.67M | 52W Range | 8.45 - 11.09 |
|
|
|
|
Amcor Plc operates as a holding company, which engages in the consumer packaging business. It operates through the Flexibles and Rigid Packaging segments. The Flexibles segment develops and supplies flexible packaging globally. The Rigid Plastics segment manufactures rigid plastic containers and related products. The company was founded 1926 and is headquartered in Warmley, the United Kingdom. |
| Insider Trading |
Relationship |
Date |
Transaction |
Cost |
#Shares |
Value ($) |
#Shares Total |
SEC Form 4 |
| Roegner Eric V | PRESIDENT,AMCOR RIGID PKG | Feb 09 '24 | Buy | 9.10 | 1,560 | 14,197 | 520 | Feb 13 03:23 PM | | Guerra Karen Jane | Director | Feb 09 '24 | Sale | 9.02 | 25,000 | 225,444 | 75,424 | Feb 13 03:30 PM | | NAYAR ARUN | Director | Dec 01 '23 | Sale | 9.39 | 10,261 | 96,351 | 52,527 | Dec 05 04:50 PM | | Long Nicholas T. | Director | Dec 01 '23 | Sale | 9.39 | 9,699 | 91,074 | 36,922 | Dec 05 04:47 PM | | Bertone Andrea E. | Director | Dec 01 '23 | Sale | 9.39 | 9,692 | 91,008 | 27,394 | Dec 05 04:31 PM |
|
|
|
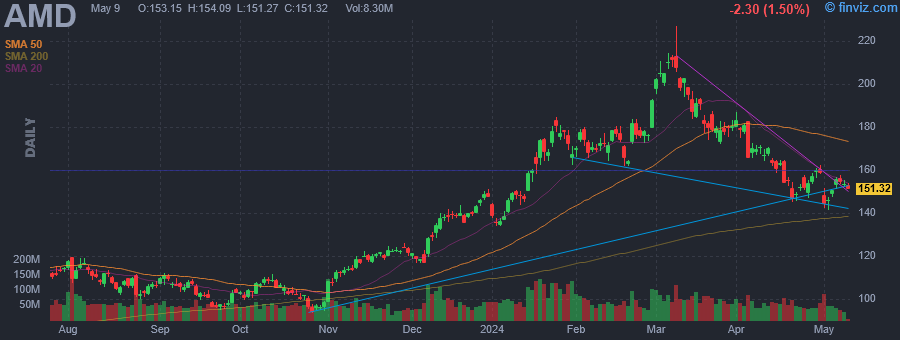 |
| Market Cap | 255.96B | EPS (ttm) | 0.52 |
| P/E | 302.66 | EPS this Y | 37.78% |
| Forward P/E | 28.68 | EPS next Y | 51.27% |
| PEG | 12.12 | EPS past 5Y | 10.43% |
| P/S | 11.29 | EPS next 5Y | 24.96% |
| P/B | 4.58 | EPS Q/Q | 3049.23% |
| Dividend | - | Sales Q/Q | 10.16% |
| Insider Own | 1.07% | Inst Own | 71.65% |
| Insider Trans | -3.92% | Inst Trans | 3.25% |
| Short Float | 2.02% | Earnings | Apr 30/a |
| Analyst Recom | 1.59 | Target Price | 199.92 |
| Avg Volume | 67.27M | 52W Range | 81.02 - 227.30 |
|
|
|
|
Advanced Micro Devices, Inc. engages in the provision of semiconductor businesses. It operates through the following segments: Data Center, Client, Gaming, and Embedded. The Data Center segment includes server-class CPUs, GPUs, AI accelerators, DPUs, FPGAs, SmartNICs, and Adaptive SoC products. The Client segment refers to the computing platforms, which are a collection of technologies that are designed to work together to provide a more complete computing solution. The Gaming segment is a fundamental component across many products and can be found in APU, GPU, SoC or a combination of a discrete GPU with another product working in tandem. The Embedded segment focuses on the embedded CPUs, GPUs, APUs, FPGAs, and Adaptive SoC products. The company was founded by W. J. Sanders III on May 1, 1969 and is headquartered in Santa Clara, CA. |
| Insider Trading |
Relationship |
Date |
Transaction |
Cost |
#Shares |
Value ($) |
#Shares Total |
SEC Form 4 |
| Papermaster Mark D | Chief Technology Officer & EVP | Apr 15 '24 | Option Exercise | 12.83 | 16,200 | 207,846 | 1,570,802 | Apr 17 04:11 PM | | SMITH DARLA M | Chief Accounting Officer | Apr 15 '24 | Option Exercise | 0.00 | 629 | 0 | 6,099 | Apr 17 04:13 PM | | Papermaster Mark D | Chief Technology Officer & EVP | Apr 15 '24 | Sale | 164.25 | 16,200 | 2,660,850 | 1,554,602 | Apr 17 04:11 PM | | Papermaster Mark D | Chief Technology Officer & EVP | Mar 15 '24 | Option Exercise | 12.83 | 16,200 | 207,846 | 1,570,802 | Mar 19 04:17 PM | | HUYNH JACK M | SVP & GM, Computing & Graphics | Mar 15 '24 | Option Exercise | 0.00 | 1,970 | 0 | 419,581 | Mar 19 04:19 PM |
|
|
| |
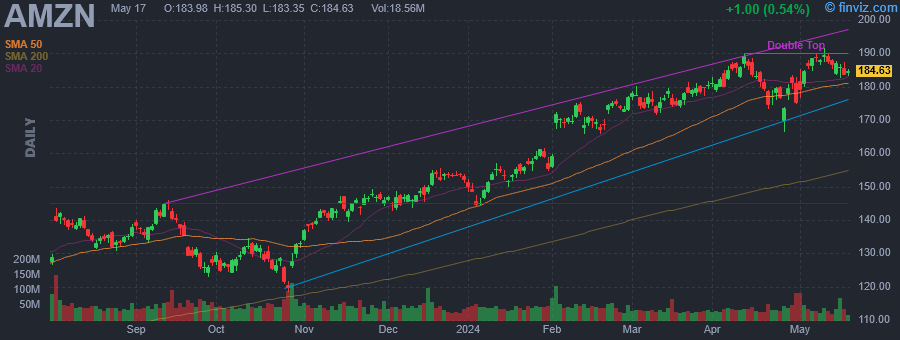 |
| Market Cap | 1819.51B | EPS (ttm) | 2.89 |
| P/E | 60.56 | EPS this Y | 44.34% |
| Forward P/E | 32.49 | EPS next Y | 28.68% |
| PEG | 1.99 | EPS past 5Y | 23.55% |
| P/S | 3.17 | EPS next 5Y | 30.50% |
| P/B | 9.00 | EPS Q/Q | 3608.52% |
| Dividend | - | Sales Q/Q | 13.91% |
| Insider Own | 11.09% | Inst Own | 61.95% |
| Insider Trans | -4.18% | Inst Trans | 0.60% |
| Short Float | 0.82% | Earnings | Apr 30/a |
| Analyst Recom | 1.22 | Target Price | 212.65 |
| Avg Volume | 42.31M | 52W Range | 101.15 - 189.77 |
|
|
|
|
Amazon.com, Inc. is a multinational technology company, which engages in providing online retail shopping services. It operates through the following segments: North America, International, and Amazon Web Services (AWS). The North America segment is involved in the retail sales of consumer products including from sellers and subscriptions through North America-focused online and physical stores. The International segment focuses on the amounts earned from retail sales of consumer products including from sellers and subscriptions through internationally focused online stores. The AWS segment includes global sales of computer, storage, database, and other services for start-ups, enterprises, government agencies, and academic institutions. The company was founded by Jeffrey P. Bezos in July 1994 and is headquartered in Seattle, WA. |
| Insider Trading |
Relationship |
Date |
Transaction |
Cost |
#Shares |
Value ($) |
#Shares Total |
SEC Form 4 |
| Selipsky Adam | CEO Amazon Web Services | Apr 19 '24 | Sale | 179.00 | 500 | 89,500 | 130,100 | Apr 22 04:25 PM | | Selipsky Adam | CEO Amazon Web Services | Apr 18 '24 | Sale | 181.38 | 500 | 90,690 | 130,600 | Apr 22 04:25 PM | | Selipsky Adam | CEO Amazon Web Services | Apr 05 '24 | Sale | 182.53 | 500 | 91,265 | 131,100 | Apr 08 04:24 PM | | Selipsky Adam | CEO Amazon Web Services | Apr 04 '24 | Sale | 184.00 | 500 | 92,000 | 131,600 | Apr 08 04:24 PM | | Herrington Douglas J | CEO Worldwide Amazon Stores | Apr 01 '24 | Sale | 180.73 | 3,500 | 632,555 | 512,858 | Apr 03 05:24 PM |
|
|
|
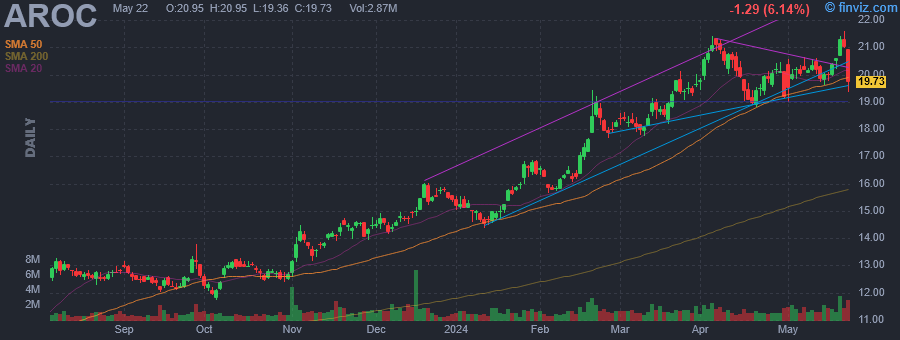 |
| Market Cap | 3.00B | EPS (ttm) | 0.67 |
| P/E | 28.79 | EPS this Y | 48.76% |
| Forward P/E | 16.22 | EPS next Y | 18.73% |
| PEG | - | EPS past 5Y | 29.28% |
| P/S | 3.03 | EPS next 5Y | -12.91% |
| P/B | 3.44 | EPS Q/Q | 218.18% |
| Dividend | 3.63% | Sales Q/Q | 18.61% |
| Insider Own | 14.33% | Inst Own | 91.22% |
| Insider Trans | 0.00% | Inst Trans | -0.79% |
| Short Float | 3.97% | Earnings | Apr 30/a |
| Analyst Recom | 1.33 | Target Price | 21.00 |
| Avg Volume | 1.34M | 52W Range | 8.78 - 21.40 |
|
|
|
|
Archrock, Inc. engages in the provision of operations, maintenance, service and equipment for oil and natural gas production, processing, and transportation applications. It operates through the Contract Operations and Aftermarket Services. The Contract Operations segment includes the owned fleet of natural gas compression equipment that the company uses to provide operations services. The Aftermarket Services segment sell parts and components, and provides operations, maintenance, overhaul, and reconfiguration services to customers. The company was founded in 1954 and is headquartered in Houston, TX. |
| Insider Trading |
Relationship |
Date |
Transaction |
Cost |
#Shares |
Value ($) |
#Shares Total |
SEC Form 4 |
| Henderson Donna A | VP, CHIEF ACCOUNTING OFFICER | Aug 23 '23 | Sale | 12.77 | 10,802 | 137,942 | 39,237 | Aug 23 04:43 PM |
|
|
| |
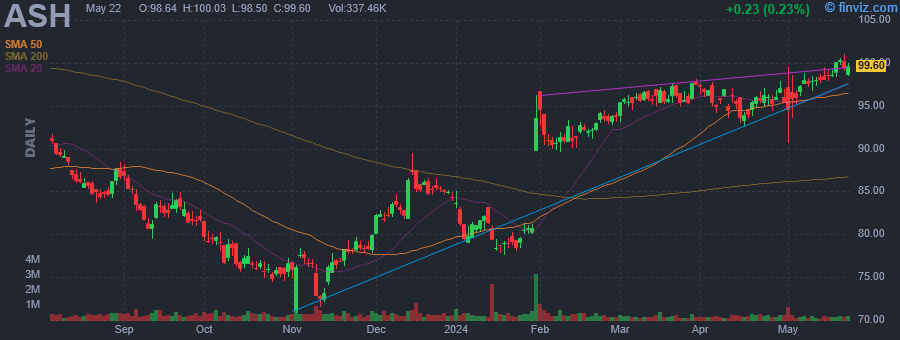 |
| Market Cap | 4.78B | EPS (ttm) | 3.09 |
| P/E | 30.88 | EPS this Y | 9.20% |
| Forward P/E | 16.71 | EPS next Y | 29.34% |
| PEG | 1.42 | EPS past 5Y | 13.52% |
| P/S | 2.23 | EPS next 5Y | 21.77% |
| P/B | 1.56 | EPS Q/Q | -23.72% |
| Dividend | 1.70% | Sales Q/Q | -9.90% |
| Insider Own | 0.61% | Inst Own | 93.79% |
| Insider Trans | -0.55% | Inst Trans | -0.50% |
| Short Float | 2.01% | Earnings | Apr 30/a |
| Analyst Recom | 1.67 | Target Price | 107.64 |
| Avg Volume | 415.86K | 52W Range | 70.82 - 101.94 |
|
|
|
|
Ashland, Inc. engages in the provision of architectural coatings, construction, energy, food and beverage, nutraceuticals, personal care, and pharmaceutical products. It operates through the following segments: Life Sciences, Personal Care, Specialty Additives, and Intermediates. The Life Sciences segment is involved in pharmaceuticals, nutrition, nutraceuticals, agricultural chemicals, diagnostic films, and fine chemicals. The Personal Care segment consists of biofunctionals, microbial protectants, skin care, sun care, oral care, hair care, and household solutions. The Specialty Additives segment focuses on rheology and performance-enhancing additives serving the architectural coatings, construction, energy, automotive, and various industrial markets. The Intermediates segment refers to production of 1,4 butanediol and related derivatives, including n-methylpyrrolidone. The company was founded in 1924 and is headquartered in Wilmington, DE. |
| Insider Trading |
Relationship |
Date |
Transaction |
Cost |
#Shares |
Value ($) |
#Shares Total |
SEC Form 4 |
| LAMPKIN ROBIN E. | SVP, Gen Counsel and Secrty. | Feb 16 '24 | Sale | 92.54 | 844 | 78,104 | 2,883 | Feb 20 04:15 PM | | CHONG MIN | SVP, Gen. Mgr. | Jan 02 '24 | Option Exercise | 83.70 | 6,900 | 577,530 | 14,800 | Jan 04 06:01 PM | | BONI ERIC N | Principal Accounting Officer | Dec 07 '23 | Sale | 82.38 | 843 | 69,446 | 13,072 | Dec 08 07:18 PM | | BONI ERIC N | Principal Accounting Officer | Dec 06 '23 | Option Exercise | 47.63 | 843 | 40,152 | 13,915 | Dec 08 07:18 PM | | MUSA OSAMA M | Sr. Vice President | Nov 28 '23 | Option Exercise | 47.36 | 2,825 | 133,792 | 22,262 | Nov 30 05:48 PM |
|
|
|
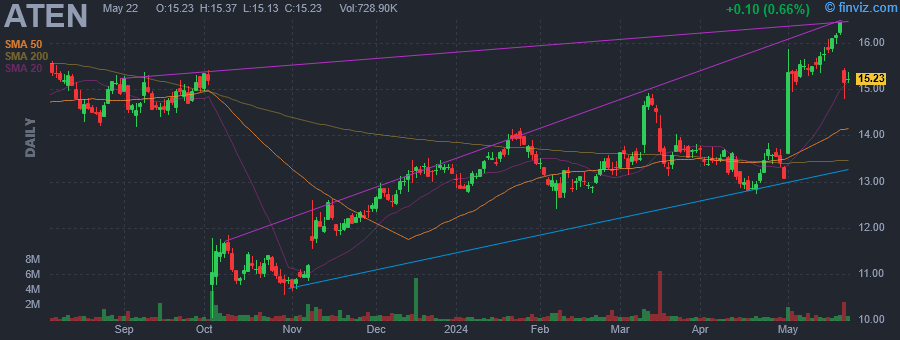 |
| Market Cap | 972.97M | EPS (ttm) | 0.53 |
| P/E | 24.60 | EPS this Y | 5.34% |
| Forward P/E | 14.90 | EPS next Y | 14.00% |
| PEG | 1.23 | EPS past 5Y | - |
| P/S | 3.87 | EPS next 5Y | 20.00% |
| P/B | 4.67 | EPS Q/Q | -0.08% |
| Dividend | 1.84% | Sales Q/Q | -9.30% |
| Insider Own | 7.70% | Inst Own | 96.51% |
| Insider Trans | -2.94% | Inst Trans | -5.18% |
| Short Float | 4.35% | Earnings | Apr 30/a |
| Analyst Recom | 1.75 | Target Price | 16.00 |
| Avg Volume | 707.87K | 52W Range | 10.03 - 15.99 |
|
|
|
|
A10 Networks, Inc. engages in the provision of networking solutions. The firm offers security, hybrid cloud, service providers, vertical solutions, and mobile carriers. It operates through the following geographical segments: Americas, Asia-Pacific and Japan, Europe, the Middle East, and Africa. The company was founded by Lee Chen in 2004 and is headquartered in San Jose, CA. |
| Insider Trading |
Relationship |
Date |
Transaction |
Cost |
#Shares |
Value ($) |
#Shares Total |
SEC Form 4 |
| Trivedi Dhrupad | Chief Executive Officer | Mar 05 '24 | Sale | 13.27 | 60,606 | 804,242 | 495,814 | Mar 07 06:58 PM | | Becker Brian | Chief Financial Officer | Feb 13 '24 | Sale | 12.93 | 15,000 | 193,950 | 34,252 | Feb 15 06:37 PM | | Trivedi Dhrupad | Chief Executive Officer | Feb 05 '24 | Sale | 13.06 | 8,679 | 113,348 | 556,420 | Feb 06 05:45 PM | | Becker Brian | Chief Financial Officer | Feb 05 '24 | Sale | 13.06 | 2,047 | 26,734 | 49,252 | Feb 06 05:44 PM | | Trivedi Dhrupad | Chief Executive Officer | Feb 02 '24 | Sale | 13.21 | 28,957 | 382,522 | 565,099 | Feb 06 05:45 PM |
|
|
| |
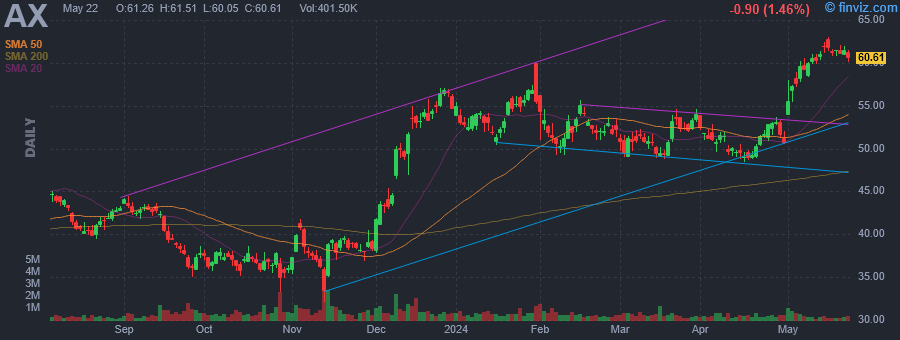 |
| Market Cap | 2.88B | EPS (ttm) | 6.78 |
| P/E | 7.46 | EPS this Y | 44.64% |
| Forward P/E | 7.51 | EPS next Y | -8.10% |
| PEG | 0.75 | EPS past 5Y | 16.42% |
| P/S | 1.87 | EPS next 5Y | 10.00% |
| P/B | 1.39 | EPS Q/Q | 94.40% |
| Dividend | - | Sales Q/Q | 38.25% |
| Insider Own | 9.87% | Inst Own | 87.26% |
| Insider Trans | -0.91% | Inst Trans | -0.38% |
| Short Float | 12.37% | Earnings | Apr 30/a |
| Analyst Recom | 1.50 | Target Price | 68.33 |
| Avg Volume | 527.41K | 52W Range | 32.05 - 60.00 |
|
|
|
|
Axos Financial, Inc. is a holding company, which engages in the provision of banking and financing services. It operates through the Banking Business and Securities Business segments. The Banking Business segment includes online banking, concierge banking, prepaid card services, mortgage, vehicle, unsecured lending through online, and telephonic distribution channels. The Securities Business segment involves clearing broker-dealer, registered investment advisor, and introducing broker-dealer lines of businesses. The company was founded on July 6, 1999 and is headquartered in Las Vegas, NV. |
| Insider Trading |
Relationship |
Date |
Transaction |
Cost |
#Shares |
Value ($) |
#Shares Total |
SEC Form 4 |
| MATSUMOTO RAYMOND D | EVP, Chief Operating Officer | Mar 23 '24 | Option Exercise | 52.25 | 1,862 | 97,290 | 30,111 | Mar 27 06:07 PM | | Constantine Thomas M | EVP, Chief Credit Officer | Mar 23 '24 | Option Exercise | 52.25 | 1,504 | 78,584 | 20,838 | Mar 27 06:07 PM | | Walsh Derrick | EVP, Chief Financial Officer | Mar 23 '24 | Option Exercise | 52.25 | 1,433 | 74,874 | 34,987 | Mar 27 06:08 PM | | Swanson Brian D | EVP, Head of Consumer Bank | Mar 23 '24 | Option Exercise | 52.25 | 1,418 | 74,090 | 49,420 | Mar 27 06:08 PM | | Bar-Adon Eshel | EVP, Chief Legal Officer | Mar 23 '24 | Option Exercise | 52.25 | 1,289 | 67,350 | 122,143 | Mar 27 06:06 PM |
|
|
|
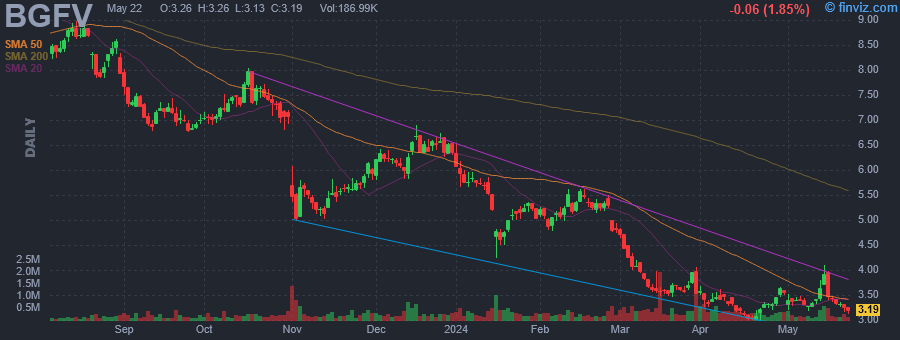 |
| Market Cap | 79.44M | EPS (ttm) | -0.33 |
| P/E | - | EPS this Y | - |
| Forward P/E | - | EPS next Y | - |
| PEG | - | EPS past 5Y | -14.12% |
| P/S | 0.09 | EPS next 5Y | -6.54% |
| P/B | 0.33 | EPS Q/Q | -615.23% |
| Dividend | 19.07% | Sales Q/Q | -17.61% |
| Insider Own | 6.41% | Inst Own | 42.14% |
| Insider Trans | 0.00% | Inst Trans | -3.68% |
| Short Float | 18.19% | Earnings | Apr 30/a |
| Analyst Recom | 3.00 | Target Price | 4.50 |
| Avg Volume | 402.50K | 52W Range | 3.00 - 9.99 |
|
|
|
|
Big 5 Sporting Goods Corp. operates as a holding company. The firm engages in the retail of sporting goods. Its products include athletic shoes, apparel and accessories, as well as outdoor and athletic equipment for team sports, fitness, camping, hunting, fishing, tennis, golf, winter and summer recreation and roller sports. The company was founded by Maurie I. Liff, Harry A. Liff and Robert W. Miller in 1955 and is headquartered in El Segundo, CA. |
| Insider Trading |
Relationship |
Date |
Transaction |
Cost |
#Shares |
Value ($) |
#Shares Total |
SEC Form 4 |
| FRALEY JEFFREY L | Senior VP, Human Resources | May 30 '23 | Sale | 7.69 | 3,764 | 28,945 | 16,075 | May 31 05:01 PM | | Starr Shane O | Senior VP, Operations | May 04 '23 | Sale | 7.17 | 3,752 | 26,902 | 17,250 | May 05 06:05 PM |
|
|
|
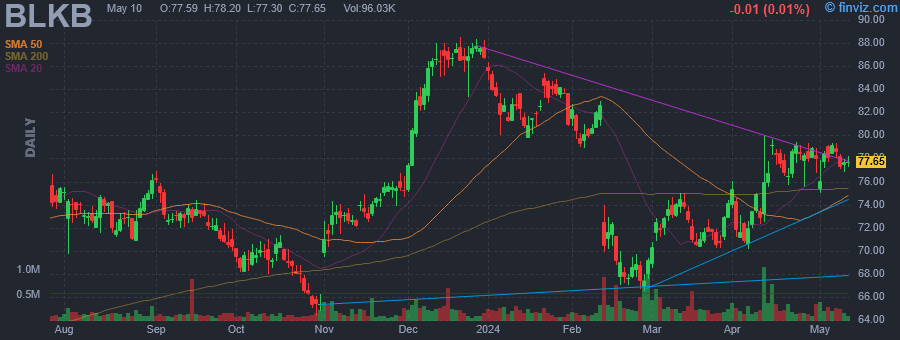 |
| Market Cap | 4.02B | EPS (ttm) | 0.02 |
| P/E | 3373.16 | EPS this Y | 6.48% |
| Forward P/E | 16.44 | EPS next Y | 11.85% |
| PEG | 344.20 | EPS past 5Y | -48.47% |
| P/S | 3.64 | EPS next 5Y | 9.80% |
| P/B | 5.17 | EPS Q/Q | 124.13% |
| Dividend | - | Sales Q/Q | 7.37% |
| Insider Own | 20.28% | Inst Own | 79.57% |
| Insider Trans | -0.87% | Inst Trans | -0.80% |
| Short Float | 2.04% | Earnings | Apr 30/a |
| Analyst Recom | 2.57 | Target Price | 84.75 |
| Avg Volume | 300.64K | 52W Range | 64.32 - 88.56 |
|
|
|
|
Blackbaud, Inc. engages in the provision of cloud-based and on-premises software solutions and related services for the global philanthropic community. It offers solutions for fundraising and constituent relationship management (CRM), marketing, advocacy, accounting, peer-to-peer fundraising, corporate social responsibility (CSR), school management, ticketing, financial management, payment processing, and analytics. The company was founded by Anthony E. Bakker in 1981 and is headquartered in Charleston, SC. |
| Insider Trading |
Relationship |
Date |
Transaction |
Cost |
#Shares |
Value ($) |
#Shares Total |
SEC Form 4 |
| BOOR ANTHONY W | CFO & Exec VP of Fin. & Admin. | Apr 15 '24 | Sale | 79.01 | 6,900 | 545,137 | 151,368 | Apr 15 04:42 PM | | Gregoire Kevin P. | EVP, Chief Operating Officer | Apr 11 '24 | Sale | 79.00 | 5,000 | 395,000 | 128,641 | Apr 15 04:43 PM | | BOOR ANTHONY W | CFO & Exec VP of Fin. & Admin. | Apr 11 '24 | Sale | 79.48 | 3,100 | 246,401 | 158,268 | Apr 15 04:42 PM | | Gianoni Michael P | President and CEO | Mar 11 '24 | Sale | 74.02 | 5,799 | 429,232 | 402,060 | Mar 11 06:02 PM | | BOOR ANTHONY W | CFO & Exec VP of Fin. & Admin. | Mar 11 '24 | Sale | 74.00 | 429 | 31,746 | 161,368 | Mar 11 05:22 PM |
|
|
|
