 |
| Market Cap | 204.37M | EPS (ttm) | 0.04 |
| P/E | 224.38 | EPS this Y | - |
| Forward P/E | - | EPS next Y | - |
| PEG | - | EPS past 5Y | - |
| P/S | 12.17 | EPS next 5Y | - |
| P/B | 1.07 | EPS Q/Q | - |
| Dividend | 3.93% | Sales Q/Q | 3.50% |
| Insider Own | - | Inst Own | 55.20% |
| Insider Trans | - | Inst Trans | - |
| Short Float | 0.20% | Earnings | - |
| Analyst Recom | - | Target Price | - |
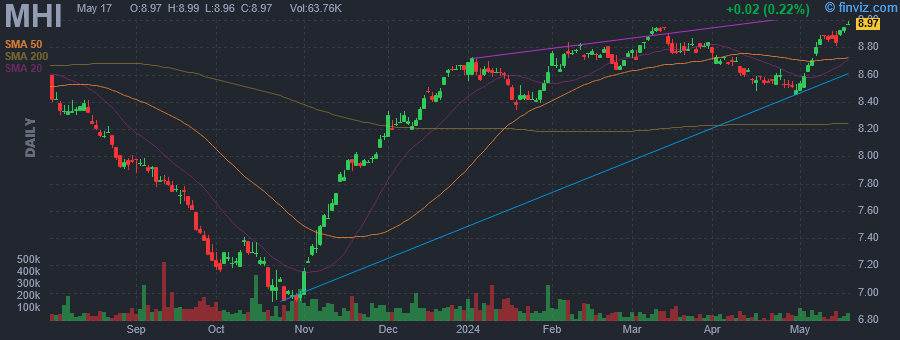
| Avg Volume | 52.41K | 52W Range | 6.93 - 9.01 |
|
|
|
|
Pioneer Municipal High Income Fund, Inc. is a closed-ended fixed income mutual fund launched and managed by Pioneer Investment Management, Inc. It invests in the fixed income markets of the United States. The fund primarily invests in municipal securities. It seeks to invest in securities across the credit rating and maturity spectrum. The fund benchmarks the performance of its portfolio against the Barclays Municipal Bond Index and Barclays High Yield Municipal Bond Index. Pioneer Municipal High Income Fund, Inc. was formed on March 13, 2003 and is domiciled in the United States. |
| Insider Trading |
Relationship |
Date |
Transaction |
Cost |
#Shares |
Value ($) |
#Shares Total |
SEC Form 4 |
| Saba Capital Management, L.P. | 10% Owner | May 15 '24 | Buy | 8.91 | 11,105 | 98,946 | 3,449,685 | May 17 01:03 PM | | Saba Capital Management, L.P. | 10% Owner | May 03 '24 | Buy | 8.64 | 4,765 | 41,170 | 3,438,580 | May 07 05:12 PM | | Saba Capital Management, L.P. | 10% Owner | May 02 '24 | Buy | 8.56 | 32,971 | 282,232 | 3,433,815 | May 03 01:12 PM | | Saba Capital Management, L.P. | 10% Owner | Mar 11 '24 | Buy | 8.93 | 30,534 | 272,669 | 3,400,844 | Mar 12 05:54 PM | | Saba Capital Management, L.P. | 10% Owner | Mar 01 '24 | Buy | 8.76 | 5,666 | 49,634 | 3,370,310 | Mar 04 06:09 PM |
|
|
 |
 |
| Market Cap | 193.47M | EPS (ttm) | -0.06 |
| P/E | - | EPS this Y | - |
| Forward P/E | - | EPS next Y | - |
| PEG | - | EPS past 5Y | - |
| P/S | 10.76 | EPS next 5Y | - |
| P/B | 1.00 | EPS Q/Q | - |
| Dividend | 4.23% | Sales Q/Q | 5.00% |
| Insider Own | - | Inst Own | 46.63% |
| Insider Trans | - | Inst Trans | - |
| Short Float | 0.10% | Earnings | - |
| Analyst Recom | - | Target Price | - |
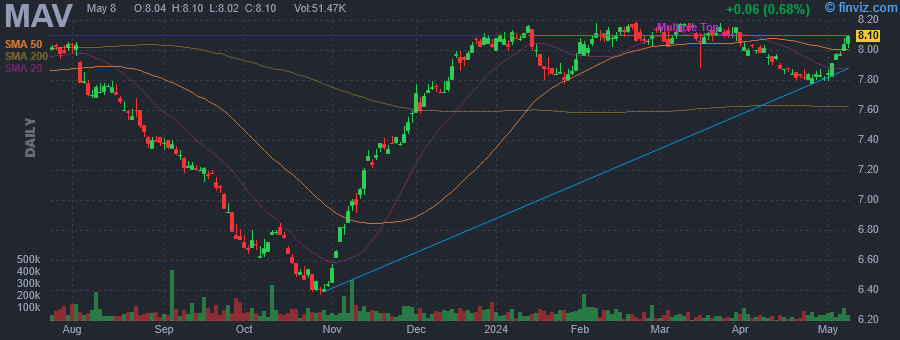
| Avg Volume | 48.65K | 52W Range | 6.37 - 8.19 |
|
|
|
|
Pioneer Municipal High Income Advantage Fund, Inc. is a closed ended fixed income mutual fund launched and managed by Pioneer Investment Management, Inc. The fund invests in the fixed income markets of the United States. It invests primarily in municipal bonds. The fund benchmarks the performance of its portfolio against the Barclays Capital High Yield Municipal Bond Index and the Barclays Capital Municipal Bond Index. It was formerly known as Pioneer Municipal Advantage Trust. Pioneer Municipal High Income Advantage Fund, Inc. was formed on August 6, 2003 and is domiciled in the United States. |
| Insider Trading |
Relationship |
Date |
Transaction |
Cost |
#Shares |
Value ($) |
#Shares Total |
SEC Form 4 |
| Saba Capital Management, L.P. | 10% Owner | May 15 '24 | Buy | 8.08 | 49,514 | 400,073 | 2,800,265 | May 17 12:47 PM | | Saba Capital Management, L.P. | 10% Owner | May 03 '24 | Buy | 7.96 | 13,162 | 104,770 | 2,750,751 | May 07 05:09 PM | | Saba Capital Management, L.P. | 10% Owner | May 02 '24 | Buy | 7.87 | 35,879 | 282,368 | 2,737,589 | May 02 04:52 PM | | Saba Capital Management, L.P. | 10% Owner | May 01 '24 | Buy | 7.82 | 24,037 | 187,969 | 2,701,710 | May 02 04:52 PM | | Saba Capital Management, L.P. | 10% Owner | Apr 25 '24 | Buy | 7.81 | 38,952 | 304,215 | 2,677,669 | Apr 26 11:43 AM |
|
|
|
 |
| Market Cap | 388.24M | EPS (ttm) | 0.79 |
| P/E | 17.97 | EPS this Y | - |
| Forward P/E | - | EPS next Y | - |
| PEG | - | EPS past 5Y | - |
| P/S | 110.52 | EPS next 5Y | - |
| P/B | 0.88 | EPS Q/Q | - |
| Dividend | 7.12% | Sales Q/Q | 34.40% |
| Insider Own | - | Inst Own | 34.38% |
| Insider Trans | - | Inst Trans | - |
| Short Float | 0.21% | Earnings | - |
| Analyst Recom | - | Target Price | - |
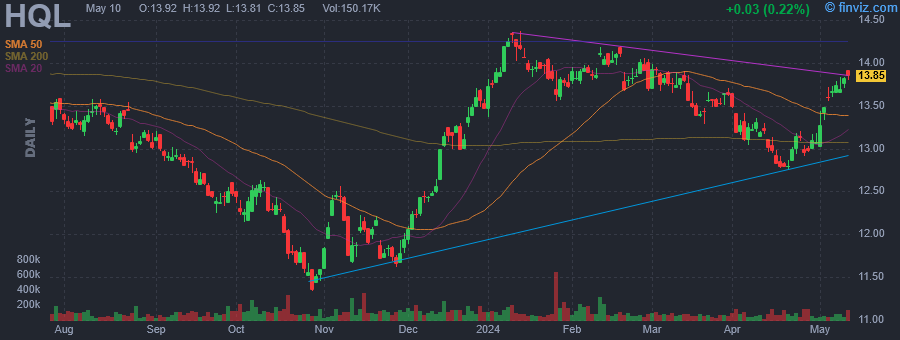
| Avg Volume | 84.90K | 52W Range | 11.34 - 14.37 |
|
|
|
|
Tekla Life Sciences Investors is a closed-ended equity mutual fund launched and managed by Tekla Capital Management LLC. The fund invests in public equity markets across the globe. It seeks to invest in stocks of companies operating in the life sciences sector, including the biotechnology, pharmaceutical, diagnostics, managed healthcare, medical equipment, hospitals, healthcare information technology and services, devices and supplies industries, and in agriculture and environmental management industries. The fund primarily invests in growth stocks of small cap companies. It employs fundamental analysis with a focus on factors such as market position for services or products, experience of business management, technological expertise, and the ability either to generate funds internally to finance growth or to secure outside sources of capital to create its portfolio. The fund benchmarks the performance of its portfolio against the NASDAQ Biotech Index and the S&P 500 Index. It was formerly known as H&Q Life Sciences Investors fund. Tekla Life Sciences Investors was formed on February 20, 1992 and is domiciled in the United States. |
| Insider Trading |
Relationship |
Date |
Transaction |
Cost |
#Shares |
Value ($) |
#Shares Total |
SEC Form 4 |
| Saba Capital Management, L.P. | 10% Owner | May 15 '24 | Buy | 14.19 | 34,755 | 493,173 | 3,250,580 | May 17 12:34 PM | | Saba Capital Management, L.P. | 10% Owner | May 10 '24 | Buy | 13.86 | 57,862 | 801,967 | 3,215,825 | May 14 01:50 PM | | Saba Capital Management, L.P. | 10% Owner | May 09 '24 | Buy | 13.80 | 17,373 | 239,747 | 3,157,963 | May 10 10:31 AM | | Saba Capital Management, L.P. | 10% Owner | May 08 '24 | Buy | 13.70 | 10,986 | 150,508 | 3,140,590 | May 10 10:31 AM | | Saba Capital Management, L.P. | 10% Owner | May 07 '24 | Buy | 13.76 | 50,161 | 690,215 | 3,129,604 | May 07 05:07 PM |
|
|
| |
 |
| Market Cap | 313.03M | EPS (ttm) | -0.05 |
| P/E | - | EPS this Y | - |
| Forward P/E | - | EPS next Y | - |
| PEG | - | EPS past 5Y | -1.84% |
| P/S | 12.68 | EPS next 5Y | - |
| P/B | 1.00 | EPS Q/Q | - |
| Dividend | 3.60% | Sales Q/Q | 3.10% |
| Insider Own | - | Inst Own | 61.97% |
| Insider Trans | - | Inst Trans | - |
| Short Float | 0.05% | Earnings | - |
| Analyst Recom | - | Target Price | - |
| Avg Volume | 62.51K | 52W Range | 8.95 - 11.05 |
|
|
|
|
AllianceBernstein National Municipal Income Fund, Inc. is a closed-ended fixed income mutual fund launched and managed by AllianceBernstein L.P. The fund invests in the fixed income markets of the United States. It primarily invests in investment-grade municipal securities which pay interest that is exempt from federal income tax. The fund seeks to invest in bonds rated Baa/BBB or higher. It employs both quantitative and fundamental analysis to create its portfolio. AllianceBernstein National Municipal Income Fund, Inc. was formed on November 9, 2001 and is domiciled in the United States. |
| Insider Trading |
Relationship |
Date |
Transaction |
Cost |
#Shares |
Value ($) |
#Shares Total |
SEC Form 4 |
| Saba Capital Management, L.P. | 10% Owner | May 16 '24 | Buy | 10.91 | 43,712 | 476,898 | 2,972,154 | May 17 12:32 PM | | Saba Capital Management, L.P. | 10% Owner | May 15 '24 | Buy | 10.92 | 11,181 | 122,097 | 2,928,442 | May 17 12:32 PM |
|
|
|
 |
| Market Cap | 1.80B | EPS (ttm) | -0.45 |
| P/E | - | EPS this Y | - |
| Forward P/E | - | EPS next Y | - |
| PEG | - | EPS past 5Y | - |
| P/S | 22.01 | EPS next 5Y | - |
| P/B | 1.12 | EPS Q/Q | - |
| Dividend | 5.95% | Sales Q/Q | 27.90% |
| Insider Own | - | Inst Own | 18.38% |
| Insider Trans | - | Inst Trans | - |
| Short Float | 0.04% | Earnings | - |
| Analyst Recom | - | Target Price | - |
| Avg Volume | 108.68K | 52W Range | 18.70 - 24.16 |
|
|
|
|
Eaton Vance Tax-Advantaged Dividend Income Fund is a closed-ended equity mutual fund launched and managed by Eaton Vance Management. The fund invests in public equity markets across the globe. It seeks to invest in stocks of companies operating across the diversified sectors. The fund primarily invests in dividend paying value stocks of companies that qualify for favorable federal income tax treatment. It benchmarks the performance of its portfolio against the Russell 1000 Value Index. Eaton Vance Tax-Advantaged Dividend Income Fund was formed on September 30, 2003 and is domiciled in the United States. |
| Insider Trading |
Relationship |
Date |
Transaction |
Cost |
#Shares |
Value ($) |
#Shares Total |
SEC Form 4 |
| Dunn Aaron | Director | May 17 '24 | Buy | 23.97 | 290 | 6,950 | 1,236 | May 17 12:23 PM | | Dunn Aaron | Director | Feb 16 '24 | Buy | 22.44 | 315 | 7,070 | 946 | Feb 16 03:08 PM | | Dunn Aaron | Director | Nov 16 '23 | Buy | 20.42 | 270 | 5,513 | 604 | Nov 17 10:11 AM | | DiGregorio Derek | Portfolio Manager | Aug 14 '23 | Buy | 23.00 | 2,859 | 65,757 | 2,859 | Aug 16 05:08 PM |
|
|
| |
 |
| Market Cap | 2.68B | EPS (ttm) | 2.89 |
| P/E | 28.78 | EPS this Y | 19.34% |
| Forward P/E | 11.99 | EPS next Y | 11.58% |
| PEG | 5.14 | EPS past 5Y | -11.48% |
| P/S | 1.24 | EPS next 5Y | 5.60% |
| P/B | 1.62 | EPS Q/Q | 26.61% |
| Dividend | 0.48% | Sales Q/Q | -2.12% |
| Insider Own | 1.38% | Inst Own | 97.45% |
| Insider Trans | -11.60% | Inst Trans | -2.26% |
| Short Float | 0.79% | Earnings | Apr 25/a |
| Analyst Recom | 1.25 | Target Price | 96.50 |
| Avg Volume | 140.05K | 52W Range | 48.61 - 84.54 |
|
|
|
|
Minerals Technologies, Inc. is a resource and technology-based company. It develops, produces, and markets a range of mineral, mineral-based, and synthetic mineral products. It operates through the Consumer and Specialties and Engineered Solutions segments. The Consumer and Specialties segment serves consumer end markets directly and provides mineral-based solutions and technologies that are essential to customers' products. The Engineered Solutions segment combines all engineered systems, mineral blends, and technologies that are designed to aid in customer processes and projects. The company was founded on February 19, 1968 and is headquartered in New York, NY. |
| Insider Trading |
Relationship |
Date |
Transaction |
Cost |
#Shares |
Value ($) |
#Shares Total |
SEC Form 4 |
| JOHNSON KRISTINA M | Director | May 16 '24 | Buy | 80.92 | 400 | 32,368 | 400 | May 17 12:04 PM | | MONAGLE DJ III | Group President | Mar 22 '24 | Option Exercise | 65.16 | 1,180 | 76,889 | 82,211 | Mar 26 11:56 AM | | MONAGLE DJ III | Group President | Mar 22 '24 | Sale | 74.12 | 1,180 | 87,459 | 81,031 | Mar 26 11:56 AM | | Hastings Jonathan J | Senior Vice President | Feb 20 '24 | Option Exercise | 38.28 | 12,922 | 494,719 | 66,784 | Feb 21 02:08 PM | | Hastings Jonathan J | Senior Vice President | Feb 20 '24 | Sale | 71.48 | 12,922 | 923,644 | 53,862 | Feb 21 02:08 PM |
|
|
|
 |
| Market Cap | 519.64M | EPS (ttm) | 0.60 |
| P/E | 56.75 | EPS this Y | 664.40% |
| Forward P/E | 7.92 | EPS next Y | 12.56% |
| PEG | 5.68 | EPS past 5Y | -26.18% |
| P/S | 2.12 | EPS next 5Y | 10.00% |
| P/B | 1.14 | EPS Q/Q | 17.53% |
| Dividend | 1.44% | Sales Q/Q | 26.36% |
| Insider Own | 14.19% | Inst Own | 58.61% |
| Insider Trans | -0.36% | Inst Trans | -9.61% |
| Short Float | 1.31% | Earnings | Apr 16/a |
| Analyst Recom | 2.20 | Target Price | 38.00 |
| Avg Volume | 46.26K | 52W Range | 21.79 - 34.99 |
|
|
|
|
Equity Bancshares, Inc. is a bank holding company, which engages in the provision of financial services to individuals and businesses. The firm also offers online banking solutions, and commercial and personal banking services such as savings, treasury management, and loans. The company was founded by Brad S. Elliott in November 2002 and is headquartered in Wichita, KS. |
| Insider Trading |
Relationship |
Date |
Transaction |
Cost |
#Shares |
Value ($) |
#Shares Total |
SEC Form 4 |
| Everett Junetta M | Director | May 13 '24 | Buy | 34.50 | 2,903 | 100,154 | 9,813 | May 17 11:43 AM | | Elliott Brad S | Chief Executive Officer | Feb 29 '24 | Sale | 32.02 | 472 | 15,113 | 151,616 | Feb 29 11:16 AM | | Elliott Brad S | Chief Executive Officer | Feb 28 '24 | Sale | 31.57 | 6,290 | 198,575 | 152,088 | Feb 29 11:16 AM | | Huber Julie A | EVP | Feb 08 '24 | Sale | 32.14 | 1,050 | 33,747 | 56,918 | Feb 12 02:19 PM | | Reber Brett A | General Counsel | Feb 08 '24 | Sale | 32.14 | 959 | 30,822 | 29,147 | Feb 12 02:20 PM |
|
|
| |
 |
| Market Cap | 691.49M | EPS (ttm) | 0.48 |
| P/E | 100.78 | EPS this Y | 533.33% |
| Forward P/E | 10.16 | EPS next Y | 13.04% |
| PEG | 12.60 | EPS past 5Y | -34.17% |
| P/S | 2.14 | EPS next 5Y | 8.00% |
| P/B | 1.03 | EPS Q/Q | -11.94% |
| Dividend | 5.01% | Sales Q/Q | 17.51% |
| Insider Own | 9.75% | Inst Own | 64.79% |
| Insider Trans | 0.21% | Inst Trans | 1.21% |
| Short Float | 1.77% | Earnings | Apr 26/b |
| Analyst Recom | 3.00 | Target Price | 49.00 |
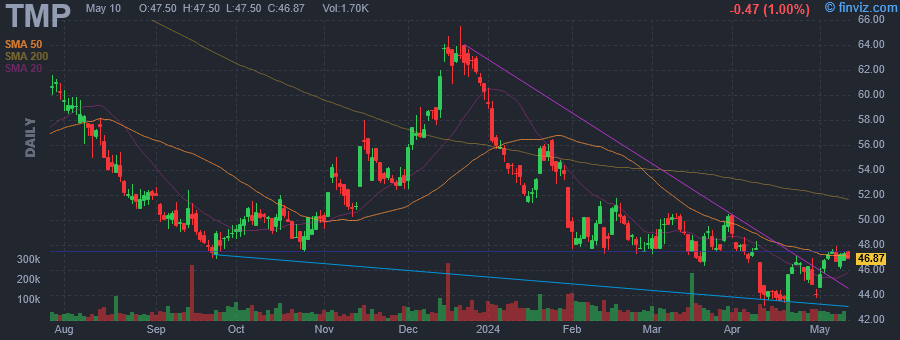
| Avg Volume | 54.59K | 52W Range | 43.09 - 65.54 |
|
|
|
|
Tompkins Financial Corp. engages in the provision of financial services. It operates through the following segments: Banking, Insurance, and Wealth Management. The Banking segment consists of its banking subsidiaries, including Tompkins Trust Co., The Bank of Castile, Mahopac Bank, and VIST Bank. The Insurance segment offers property and casualty insurance services, and employee benefits consulting. The Wealth Management segment consists of a comprehensive suite of financial services to customers, including trust and estate services, investment management, and insurance. The company was founded in 1995 and is headquartered in Ithaca, NY. |
| Insider Trading |
Relationship |
Date |
Transaction |
Cost |
#Shares |
Value ($) |
#Shares Total |
SEC Form 4 |
| Coletti Janet M. | Director | May 16 '24 | Buy | 47.91 | 1,000 | 47,910 | 2,000 | May 17 11:36 AM | | Rahilly Ita M | Director | Feb 20 '24 | Buy | 50.46 | 1,982 | 100,000 | 8,454 | Feb 21 08:36 AM | | SPAIN MICHAEL H | Director | Jan 30 '24 | Option Exercise | 0.00 | 1,444 | 0 | 136,344 | Jan 31 11:47 AM | | WEBER ALFRED J | Director | Jan 30 '24 | Option Exercise | 0.00 | 646 | 0 | 13,667 | Jan 31 04:35 PM | | BATTAGLIA PAUL J. | Director | Jan 30 '24 | Option Exercise | 0.00 | 1,354 | 0 | 7,308 | Jan 31 05:00 PM |
|
|
|
 |
| Market Cap | 5.64B | EPS (ttm) | 2.48 |
| P/E | 8.12 | EPS this Y | -10.30% |
| Forward P/E | 7.75 | EPS next Y | -6.80% |
| PEG | - | EPS past 5Y | 0.63% |
| P/S | 3.08 | EPS next 5Y | -0.90% |
| P/B | 0.82 | EPS Q/Q | 34.30% |
| Dividend | 12.57% | Sales Q/Q | -0.40% |
| Insider Own | 0.23% | Inst Own | 33.97% |
| Insider Trans | 2.57% | Inst Trans | - |
| Short Float | 1.28% | Earnings | May 08/a |
| Analyst Recom | 2.70 | Target Price | 20.61 |
| Avg Volume | 1.67M | 52W Range | 18.05 - 20.82 |
|
|
|
|
FS KKR Capital Corp. is a business development company specializing in investments in debt securities. It provides customized credit solutions to private middle market U.S. companies. It invest primarily in the senior secured debt and, to a lesser extent, the subordinated debt of private middle market U.S. companies. It seeks to purchase interests in loans through secondary market transactions or directly from the target companies as primary market investments. It also seeks to invest in first lien senior secured loans, second lien secured loans and, to a lesser extent, subordinated loans, or mezzanine loans. In connection with the debt investments, the firm also receives equity interests such as warrants or options as additional consideration. It also seek to purchase minority interests in the form of common or preferred equity in our target companies, either in conjunction with one of the debt investments or through a co-investment with a financial sponsor. Additionally, on an opportunistic basis, the fund may also invest in corporate bonds and similar debt securities. The fund does not seek to invest in start-up companies, turnaround situations, or companies with speculative business plans. It seeks to invest in small and middle-market companies based in United States. The fund seeks to invest in firms with annual revenue between $10 million to $2.5 billion. It focus on providing customized one-stop credit solutions to private upper middle market companies with annual EBITDA of $50 million to $100 million at the time of investment. It seeks to exit from securities by selling them in a privately negotiated over- the- counter market. For any investments that are not able to be sold within the secondary market, the firm seeks to exit such investments through repayment, an initial public offering of equity securities, merger, sale or recapitalization. |
| Insider Trading |
Relationship |
Date |
Transaction |
Cost |
#Shares |
Value ($) |
#Shares Total |
SEC Form 4 |
| Adams Barbara | Director | May 15 '24 | Buy | 20.10 | 3,381 | 67,957 | 22,082 | May 17 10:59 AM | | Sandler Elizabeth | Director | May 14 '24 | Buy | 20.07 | 1,000 | 20,070 | 6,700 | May 14 04:12 PM | | Sandler Elizabeth | Director | Feb 29 '24 | Buy | 18.80 | 1,000 | 18,799 | 5,700 | Mar 01 05:29 PM | | Pietrzak Daniel | Co-President and CIO | Feb 28 '24 | Buy | 18.73 | 7,300 | 136,729 | 39,800 | Feb 29 05:23 PM | | Pietrzak Daniel | Co-President and CIO | Feb 28 '24 | Buy | 18.76 | 2,700 | 50,652 | 17,700 | Feb 29 05:23 PM |
|
|
|
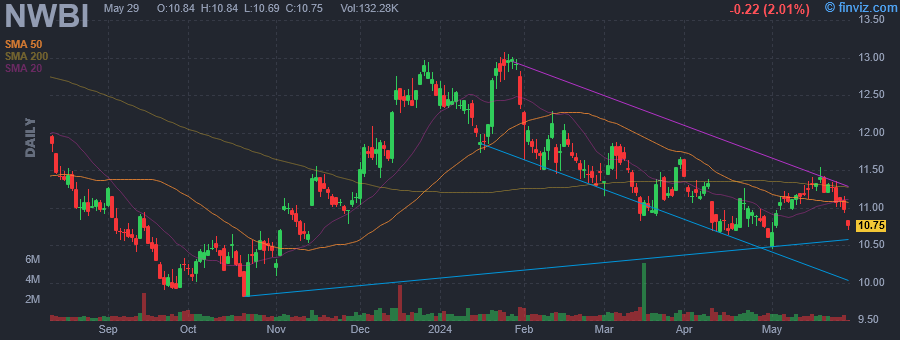 |
| Market Cap | 1.43B | EPS (ttm) | 1.02 |
| P/E | 10.99 | EPS this Y | -17.12% |
| Forward P/E | 11.44 | EPS next Y | 7.86% |
| PEG | 1.57 | EPS past 5Y | 0.80% |
| P/S | 1.96 | EPS next 5Y | 7.00% |
| P/B | 0.92 | EPS Q/Q | -13.60% |
| Dividend | 7.11% | Sales Q/Q | 18.26% |
| Insider Own | 5.20% | Inst Own | 67.02% |
| Insider Trans | 0.10% | Inst Trans | 0.32% |
| Short Float | 3.37% | Earnings | Apr 22/b |
| Analyst Recom | 3.33 | Target Price | 11.40 |
| Avg Volume | 777.83K | 52W Range | 9.80 - 13.07 |
|
|
|
|
Northwest Bancshares, Inc. is a holding company, which engages in the provision of a complete line of business and personal banking products, as well as treasury management solutions, and wealth management services. The company was founded in 1896 and is headquartered in Columbus, OH. |
| Insider Trading |
Relationship |
Date |
Transaction |
Cost |
#Shares |
Value ($) |
#Shares Total |
SEC Form 4 |
| Hunter Timothy M | Director | May 16 '24 | Buy | 11.30 | 10,000 | 113,000 | 161,474 | May 17 10:44 AM | | Cygnar Devin T | EVP, Chief Mktg/Comm. Officer | May 08 '24 | Sale | 11.08 | 3,843 | 42,580 | 11,823 | May 08 02:59 PM | | Torchio Louis J | President & CEO | May 02 '24 | Buy | 10.87 | 2,295 | 24,945 | 89,620 | May 03 01:04 PM | | Barnum Carey A. | SVP, Chief Auditor | Apr 25 '24 | Sale | 10.85 | 519 | 5,629 | 4,004 | Apr 26 10:55 AM | | Watson Scott J | EVP, Chief Information Officer | Jan 24 '24 | Buy | 12.90 | 5,000 | 64,512 | 35,282 | Jan 24 03:47 PM |
|
|
|
