 |
| Market Cap | 209.98M | EPS (ttm) | 4.78 |
| P/E | 7.44 | EPS this Y | -61.16% |
| Forward P/E | 8.28 | EPS next Y | 120.51% |
| PEG | - | EPS past 5Y | 13.36% |
| P/S | 2.45 | EPS next 5Y | - |
| P/B | 1.30 | EPS Q/Q | -18.07% |
| Dividend | 3.03% | Sales Q/Q | 1.46% |
| Insider Own | 11.88% | Inst Own | 40.49% |
| Insider Trans | -0.35% | Inst Trans | -0.25% |
| Short Float | 0.25% | Earnings | Apr 17/b |
| Analyst Recom | 2.00 | Target Price | 40.00 |
| Avg Volume | 5.62K | 52W Range | 32.12 - 45.00 |
|
|
|
|
Plumas Bancorp is a bank holding company, which engages in the provision of banking products and service. It offers a wide range of deposit products for the retail and commercial banking markets such as checking, interest-bearing and premium interest-bearing checking, business sweep, public funds sweep, savings, time deposit and retirement accounts, remote deposit, telephone and mobile banking, mobile deposit, and internet banking with bill-pay options. Its portfolio segments include commercial, agricultural, real estate construction, commercial real estate mortgage, residential mortgage, home equity loans, automobile loans, and other loans primarily consisting of consumer installment loans. The company was founded on 1980 and is headquartered in Reno, NV. |
| Insider Trading |
Relationship |
Date |
Transaction |
Cost |
#Shares |
Value ($) |
#Shares Total |
SEC Form 4 |
| Kenny Richard Francis | Director | May 17 '24 | Buy | 35.38 | 300 | 10,614 | 9,807 | May 20 11:41 AM | | North BJ | EVP and Chief Banking Officer | May 09 '24 | Sale | 35.02 | 1,136 | 39,783 | 2,496 | May 13 06:08 PM | | Belstock Richard L | EVP and CFO | Mar 04 '24 | Option Exercise | 21.45 | 1,000 | 21,450 | 46,835 | Mar 04 02:55 PM | | RYBACK ANDREW J | President and CEO | Feb 22 '24 | Option Exercise | 21.45 | 2,700 | 57,915 | 52,800 | Feb 22 02:32 PM | | Boigon Aaron M. | EVP, Chief Information Officer | Feb 08 '24 | Option Exercise | 8.75 | 7,200 | 63,000 | 7,200 | Feb 09 01:00 PM |
|
|
 |
 |
| Market Cap | 14.19B | EPS (ttm) | 18.82 |
| P/E | 32.80 | EPS this Y | -8.60% |
| Forward P/E | 8.44 | EPS next Y | 244.95% |
| PEG | 1.64 | EPS past 5Y | 14.40% |
| P/S | 21.51 | EPS next 5Y | 20.03% |
| P/B | 12.65 | EPS Q/Q | 32.60% |
| Dividend | 0.72% | Sales Q/Q | 18.90% |
| Insider Own | 0.82% | Inst Own | 59.40% |
| Insider Trans | 1.07% | Inst Trans | 0.69% |
| Short Float | 3.46% | Earnings | May 08/a |
| Analyst Recom | 2.70 | Target Price | 660.71 |
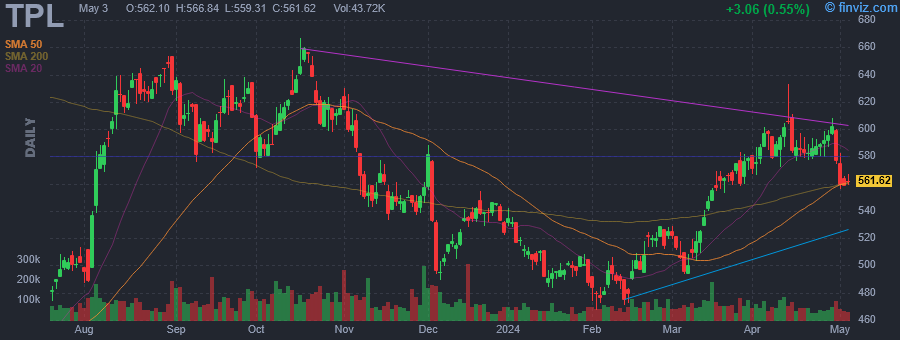
| Avg Volume | 74.88K | 52W Range | 422.07 - 666.67 |
|
|
|
|
Texas Pacific Land Corporation engages in the land and resource management, and water services and operations businesses. The company owns a 1/128th nonparticipating perpetual oil and gas royalty interest (NPRI) under approximately 85,000 acres of land; a 1/16th NPRI under approximately 371,000 acres of land; and approximately 4,000 additional net royalty acres, total of approximately 195,000 NRA located in the western part of Texas. The Land and Resource Management segment manages surface acres of land, and oil and gas royalty interest in West Texas. This segment also engages in easements, such as transporting oil, gas and related hydrocarbons, power line and utility, and subsurface wellbore easements. In addition, this segment leases its land for processing, storage, and compression facilities and roads; and is involved in sale of materials, such as caliche, sand, and other material, as well as sells land. The Water Services and Operations segment provides full-service water offerings, including water sourcing, produced-water treatment, infrastructure development, and disposal solutions to operators in the Permian Basin. This segment also holds produced water royalties. Texas Pacific Land Corporation was founded in 1888 and is headquartered in Dallas, Texas. |
| Insider Trading |
Relationship |
Date |
Transaction |
Cost |
#Shares |
Value ($) |
#Shares Total |
SEC Form 4 |
| HORIZON KINETICS ASSET MANAGEM | 10% Owner | May 17 '24 | Buy | 611.81 | 3 | 1,835 | 1,085,004 | May 20 11:06 AM | | HORIZON KINETICS ASSET MANAGEM | 10% Owner | May 16 '24 | Buy | 604.85 | 3 | 1,815 | 1,085,001 | May 17 12:03 PM | | Cook Donald G | Director | May 15 '24 | Buy | 611.17 | 10 | 6,112 | 244 | May 17 05:12 PM | | HORIZON KINETICS ASSET MANAGEM | 10% Owner | May 15 '24 | Buy | 602.07 | 3 | 1,806 | 1,084,998 | May 16 11:12 AM | | HORIZON KINETICS ASSET MANAGEM | 10% Owner | May 14 '24 | Buy | 607.39 | 3 | 1,822 | 1,084,995 | May 15 11:20 AM |
|
|
|
 |
| Market Cap | 11.16M | EPS (ttm) | -0.12 |
| P/E | - | EPS this Y | - |
| Forward P/E | - | EPS next Y | - |
| PEG | - | EPS past 5Y | - |
| P/S | 39.03 | EPS next 5Y | - |
| P/B | 0.81 | EPS Q/Q | - |
| Dividend | 0.95% | Sales Q/Q | 26.30% |
| Insider Own | 14.94% | Inst Own | 16.29% |
| Insider Trans | 0.98% | Inst Trans | - |
| Short Float | 0.04% | Earnings | - |
| Analyst Recom | - | Target Price | - |
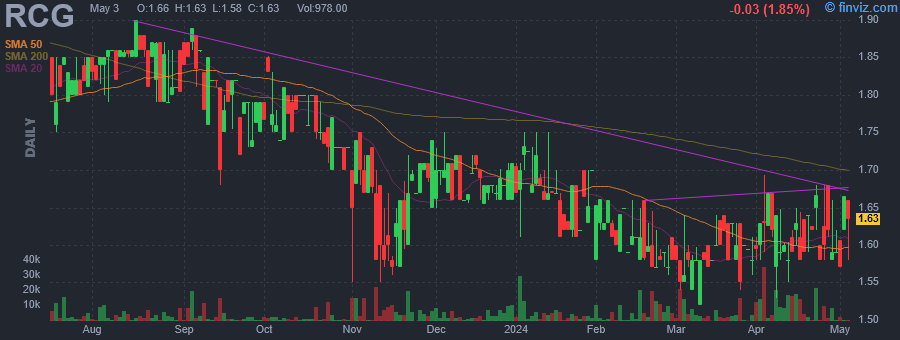
| Avg Volume | 7.66K | 52W Range | 1.52 - 1.90 |
|
|
|
|
RENN Fund, Inc. is a closed ended equity mutual fund launched by RENN Capital Group, Inc. The fund is co-managed by Horizon Kinetics Asset Management LLC. It invests in the public equity markets of the United States. The fund seeks to invest in stocks of companies operating across diversified sectors. It seeks to invest in stocks of small-cap and mid-cap companies. The fund employs a fundamental analysis with a bottom-up stock picking approach to create its portfolio. It was formerly known as RENN Global Entrepreneurs Fund, Inc. RENN Fund, Inc. was formed on January 20, 1994 and is domiciled in the United States. |
| Insider Trading |
Relationship |
Date |
Transaction |
Cost |
#Shares |
Value ($) |
#Shares Total |
SEC Form 4 |
| STAHL MURRAY | President and CEO | May 17 '24 | Buy | 1.61 | 55 | 89 | 247,906 | May 20 10:50 AM | | STAHL MURRAY | President and CEO | May 17 '24 | Buy | 1.61 | 4 | 6 | 5,079 | May 20 10:50 AM | | STAHL MURRAY | President and CEO | May 16 '24 | Buy | 1.63 | 55 | 90 | 247,882 | May 17 12:42 PM | | STAHL MURRAY | President and CEO | May 16 '24 | Buy | 1.63 | 2 | 3 | 5,075 | May 17 12:42 PM | | STAHL MURRAY | President and CEO | May 15 '24 | Buy | 1.60 | 55 | 88 | 247,858 | May 16 11:24 AM |
|
|
| |
 |
| Market Cap | 173.44M | EPS (ttm) | 1.58 |
| P/E | 17.57 | EPS this Y | - |
| Forward P/E | - | EPS next Y | - |
| PEG | - | EPS past 5Y | -9.95% |
| P/S | 0.65 | EPS next 5Y | - |
| P/B | 1.29 | EPS Q/Q | 221.66% |
| Dividend | 1.58% | Sales Q/Q | -6.30% |
| Insider Own | 7.99% | Inst Own | 70.83% |
| Insider Trans | 0.67% | Inst Trans | 7.28% |
| Short Float | 0.81% | Earnings | May 06/a |
| Analyst Recom | - | Target Price | - |
| Avg Volume | 20.39K | 52W Range | 16.10 - 35.78 |
|
|
|
|
The Eastern Co. engages in the design, manufacture and sale of industrial hardware, security products and metal products. It operates through the following segments: Engineered Solutions and Diversified Products. The Engineered Solutions segment consists of Big 3 Precision. The Diversified Products segment consists of Frazer & Jones, Greenwald Industries, and Argo EMS. The company was founded by Eben Tuttle in October 1858 and is headquartered in Shelton, CT. |
| Insider Trading |
Relationship |
Date |
Transaction |
Cost |
#Shares |
Value ($) |
#Shares Total |
SEC Form 4 |
| Hernandez Mark Anthony | Chief Executive Officer | May 17 '24 | Buy | 30.00 | 959 | 28,770 | 36,208 | May 20 10:49 AM | | Hernandez Mark Anthony | Chief Executive Officer | May 16 '24 | Buy | 28.99 | 2,341 | 67,866 | 35,249 | May 20 10:49 AM | | Hernandez Mark Anthony | Chief Executive Officer | Mar 01 '24 | Option Exercise | 0.00 | 8,332 | 0 | 27,132 | Mar 05 04:31 PM | | Vlahos Nicholas Alec | Chief Financial Officer | Mar 01 '24 | Option Exercise | 0.00 | 906 | 0 | 1,880 | Mar 05 04:34 PM | | DiSanto Frederick D. | Director | Nov 17 '23 | Buy | 18.56 | 3,300 | 61,248 | 61,346 | Nov 17 05:13 PM |
|
|
|
 |
| Market Cap | 53.74M | EPS (ttm) | -0.06 |
| P/E | - | EPS this Y | 105.00% |
| Forward P/E | 28.55 | EPS next Y | 1833.34% |
| PEG | - | EPS past 5Y | 16.60% |
| P/S | 2.78 | EPS next 5Y | 10.00% |
| P/B | 3.12 | EPS Q/Q | 66.91% |
| Dividend | - | Sales Q/Q | 10.01% |
| Insider Own | 8.27% | Inst Own | 44.10% |
| Insider Trans | 1.23% | Inst Trans | -0.56% |
| Short Float | 1.69% | Earnings | May 13/a |
| Analyst Recom | 2.00 | Target Price | 4.12 |
| Avg Volume | 515.69K | 52W Range | 1.56 - 4.25 |
|
|
|
|
Intellicheck, Inc. engages in the development, integration, and marketing of threat and identity authentication solutions. It offers professional services, retail, age, defense, guest, and port ID. The company was founded in 1994 and is headquartered in Melville, NY. |
| Insider Trading |
Relationship |
Date |
Transaction |
Cost |
#Shares |
Value ($) |
#Shares Total |
SEC Form 4 |
| Lewis Bryan | CEO/President | May 17 '24 | Buy | 2.83 | 7,000 | 19,799 | 12,482 | May 20 10:40 AM | | Robins Jonathan | Chief Technology Officer | Dec 14 '23 | Buy | 1.80 | 5,000 | 9,000 | 5,200 | Dec 14 04:23 PM | | Ishmael Jeffrey | CFO, COO | Dec 12 '23 | Buy | 1.70 | 7,503 | 12,730 | 286,403 | Dec 14 04:17 PM | | Ishmael Jeffrey | CFO, COO | Nov 15 '23 | Buy | 1.64 | 5,000 | 8,200 | 278,900 | Nov 15 04:01 PM | | Smith Guy L | Director | Nov 15 '23 | Buy | 1.67 | 1,000 | 1,670 | 330,727 | Nov 15 12:39 PM |
|
|
| |
 |
| Market Cap | 87.30M | EPS (ttm) | - |
| P/E | - | EPS this Y | - |
| Forward P/E | - | EPS next Y | - |
| PEG | - | EPS past 5Y | - |
| P/S | - | EPS next 5Y | - |
| P/B | 0.44 | EPS Q/Q | - |
| Dividend | - | Sales Q/Q | - |
| Insider Own | 11.71% | Inst Own | 17.97% |
| Insider Trans | 6.02% | Inst Trans | - |
| Short Float | 0.52% | Earnings | - |
| Analyst Recom | - | Target Price | - |
| Avg Volume | 12.61K | 52W Range | 8.01 - 10.00 |
|
|
|
Apr-30-24 04:15PM
|
SR BANCORP, INC. ANNOUNCES QUARTERLY FINANCIAL RESULTS
(PR Newswire) |
|
Jan-31-24 04:43PM
|
SR BANCORP, INC. ANNOUNCES QUARTERLY FINANCIAL RESULTS
(PR Newswire) |
|
Dec-07-23 11:00AM
|
Hedge Fund and Insider Trading News: Chris Hohn, Ray Dalio, Warren Buffet, Third Point LLC, Tidan Capital, SR Bancorp Inc (SRBK), Visa Inc (V), and More
(Insider Monkey) |
|
Sep-19-23 08:32PM
|
SOMERSET SAVINGS BANK, SLA ANNOUNCES YEAR END FINANCIAL RESULTS
(PR Newswire) |
|
SR Bancorp, Inc. is a bank holding company that engages in the provision of deposit and loan products and services through its subsidiary. The company was founded on July 20, 2022 and is headquartered in Bound Brook, NJ. |
| Insider Trading |
Relationship |
Date |
Transaction |
Cost |
#Shares |
Value ($) |
#Shares Total |
SEC Form 4 |
| Taylor William P | CEO | May 17 '24 | Buy | 9.20 | 5,000 | 45,981 | 15,200 | May 20 09:39 AM | | Taylor William P | CEO | Feb 15 '24 | Buy | 9.50 | 5,200 | 49,400 | 10,200 | Feb 16 11:57 AM | | Lebovitz Marc | Director | Dec 19 '23 | Buy | 9.76 | 5,000 | 48,796 | 10,500 | Dec 19 03:58 PM | | Lupo Thomas | Director | Dec 11 '23 | Buy | 9.60 | 2,500 | 23,991 | 12,500 | Dec 11 05:41 PM | | Orbach David M | Executive Chair | Dec 01 '23 | Buy | 9.62 | 20,000 | 192,480 | 100,000 | Dec 01 03:48 PM |
|
|
|
 |
| Market Cap | 196.03M | EPS (ttm) | -0.29 |
| P/E | - | EPS this Y | 173.33% |
| Forward P/E | 18.11 | EPS next Y | 30.49% |
| PEG | - | EPS past 5Y | -17.86% |
| P/S | 0.68 | EPS next 5Y | 15.00% |
| P/B | 2.96 | EPS Q/Q | 68.31% |
| Dividend | - | Sales Q/Q | -1.97% |
| Insider Own | 16.52% | Inst Own | 47.48% |
| Insider Trans | -1.93% | Inst Trans | 2.23% |
| Short Float | 0.12% | Earnings | May 09/a |
| Analyst Recom | 1.00 | Target Price | 14.00 |
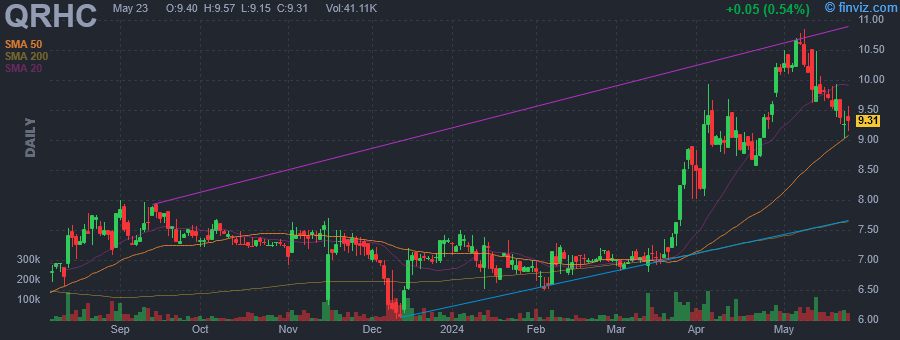
| Avg Volume | 47.01K | 52W Range | 5.02 - 10.85 |
|
|
|
|
Quest Resource Holding Corp. engages in the provision of waste and recycling services to customers from across multiple industry sectors that are typically larger, multi-location businesses. It focuses on the waste streams and recyclables from big box, food chain, and other retailers, automotive repair, maintenance, and tire operations, truck and bus fleet operators, manufacturing plants, multi-family and commercial properties, and construction and demolition projects. The company was founded in July 2002 and is headquartered in The Colony, TX. |
| Insider Trading |
Relationship |
Date |
Transaction |
Cost |
#Shares |
Value ($) |
#Shares Total |
SEC Form 4 |
| Culpepper Glenn | Director | May 16 '24 | Buy | 9.75 | 4,000 | 39,000 | 4,000 | May 20 09:01 AM | | WYNNEFIELD PARTNERS SMALL CAP | 10% Owner | Mar 13 '24 | Buy | 6.94 | 15,658 | 108,623 | 1,440,256 | Mar 15 04:15 PM | | WYNNEFIELD PARTNERS SMALL CAP | 10% Owner | Mar 13 '24 | Buy | 6.94 | 14,918 | 103,489 | 1,294,093 | Mar 15 04:15 PM | | Dunning Audrey | Director | Dec 20 '23 | Buy | 6.99 | 2,000 | 13,980 | 2,000 | Dec 22 04:03 PM | | Sweitzer David P | EVP and COO | Dec 14 '23 | Option Exercise | 2.39 | 21,033 | 50,269 | 29,544 | Dec 15 04:58 PM |
|
|
| |
 |
| Market Cap | 694.83M | EPS (ttm) | -3.26 |
| P/E | - | EPS this Y | - |
| Forward P/E | - | EPS next Y | - |
| PEG | - | EPS past 5Y | - |
| P/S | - | EPS next 5Y | - |
| P/B | - | EPS Q/Q | - |
| Dividend | 10.05% | Sales Q/Q | - |
| Insider Own | 7.50% | Inst Own | 58.77% |
| Insider Trans | 9.05% | Inst Trans | - |
| Short Float | 0.15% | Earnings | - |
| Analyst Recom | - | Target Price | - |
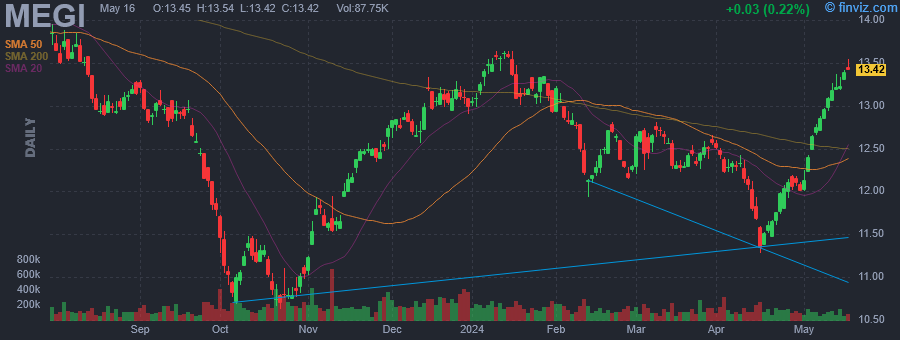
| Avg Volume | 137.18K | 52W Range | 10.63 - 14.35 |
|
|
|
|
The investment objective of MainStay CBRE Global Infrastructure Megatrends Fund (MEGI) is to seek a high level of total return with an emphasis on current income. |
| Insider Trading |
Relationship |
Date |
Transaction |
Cost |
#Shares |
Value ($) |
#Shares Total |
SEC Form 4 |
| Saba Capital Management, L.P. | 10% Owner | May 17 '24 | Buy | 13.43 | 3,280 | 44,050 | 5,631,502 | May 20 08:55 AM | | Saba Capital Management, L.P. | 10% Owner | May 15 '24 | Buy | 13.38 | 1,508 | 20,177 | 5,628,222 | May 17 12:58 PM | | Saba Capital Management, L.P. | 10% Owner | May 03 '24 | Buy | 12.53 | 9,828 | 123,145 | 5,626,714 | May 07 05:10 PM | | Saba Capital Management, L.P. | 10% Owner | May 02 '24 | Buy | 12.33 | 12,874 | 158,736 | 5,616,886 | May 03 01:10 PM | | Saba Capital Management, L.P. | 10% Owner | Apr 25 '24 | Buy | 12.03 | 45,097 | 542,517 | 5,603,993 | Apr 26 11:47 AM |
|
|
|
 |
| Market Cap | 183.30M | EPS (ttm) | -3.21 |
| P/E | - | EPS this Y | 34.29% |
| Forward P/E | - | EPS next Y | 19.55% |
| PEG | - | EPS past 5Y | 38.92% |
| P/S | 52.37 | EPS next 5Y | - |
| P/B | - | EPS Q/Q | -114.59% |
| Dividend | - | Sales Q/Q | - |
| Insider Own | 5.40% | Inst Own | 49.81% |
| Insider Trans | 2.57% | Inst Trans | 14.04% |
| Short Float | 8.59% | Earnings | May 15/b |
| Analyst Recom | 1.00 | Target Price | 15.75 |
| Avg Volume | 707.92K | 52W Range | 2.83 - 9.01 |
|
|
|
|
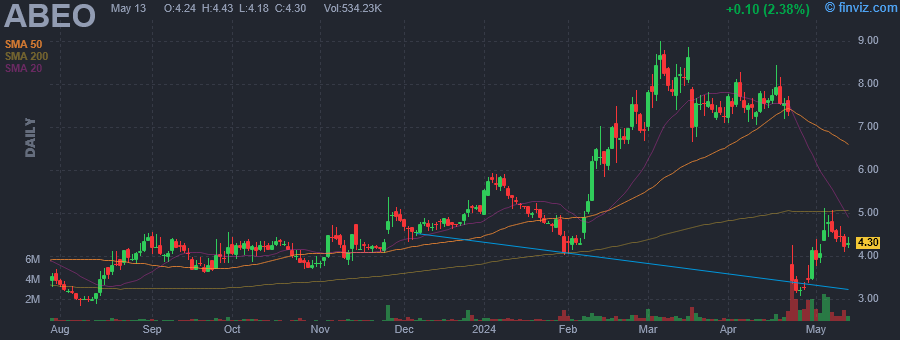
Abeona Therapeutics, Inc. is a clinical stage biopharmaceutical company, which engages in the development of gene therapy for severe and life-threatening rare diseases. It programs include EB-101 (gene-corrected skin grafts) for recessive dystrophic epidermolysis bullosa (RDEB), ABO-102 (AAV-SGSH), an adeno-associated virus (AAV) based gene therapy for Sanfilippo syndrome type A (MPS IIIA), and ABO-101 (AAV NAGLU), an AAV based gene therapy for Sanfilippo syndrome type B (MPS IIIB). The company was founded in 1974 and is headquartered in Cleveland, OH. |
| Insider Trading |
Relationship |
Date |
Transaction |
Cost |
#Shares |
Value ($) |
#Shares Total |
SEC Form 4 |
| Alland Leila | Director | May 16 '24 | Buy | 4.71 | 11,000 | 51,799 | 82,857 | May 20 08:30 AM | | Charles Faith L. | Director | Apr 26 '24 | Buy | 3.28 | 7,550 | 24,764 | 78,323 | Apr 29 08:30 AM | | Seshadri Vishwas | Chief Executive Officer | Apr 25 '24 | Buy | 3.20 | 10,000 | 32,000 | 538,260 | Apr 29 08:30 AM | | O'Malley Brendan M. | SVP, General Counsel | Apr 25 '24 | Buy | 3.24 | 8,600 | 27,864 | 188,718 | Apr 26 08:30 AM | | Vazzano Joseph Walter | Chief Financial Officer | Apr 25 '24 | Buy | 3.14 | 5,608 | 17,609 | 233,868 | Apr 26 08:30 AM |
|
|
|
 |
| Market Cap | 988.27M | EPS (ttm) | -1.00 |
| P/E | - | EPS this Y | 64.54% |
| Forward P/E | - | EPS next Y | 47.00% |
| PEG | - | EPS past 5Y | 8.72% |
| P/S | 7.80 | EPS next 5Y | - |
| P/B | 1.70 | EPS Q/Q | -24.79% |
| Dividend | - | Sales Q/Q | 81.30% |
| Insider Own | 3.26% | Inst Own | 69.17% |
| Insider Trans | 14.73% | Inst Trans | -1.58% |
| Short Float | 3.08% | Earnings | May 08/a |
| Analyst Recom | 1.00 | Target Price | 3.58 |
| Avg Volume | 2.51M | 52W Range | 1.57 - 3.16 |
|
|
|
|
Standard BioTools Inc. engages in the provision of biotechnology tools and services for clinical research. It sells preparatory and analytical instruments for mass cytometry, polymerase chain reaction, library prep, single cell genomics, and consumables including integrated fluidic circuits (IFCs), assays, and reagents. The company was founded by Stephen D. Quake and Gajus Vincent Worthington on May 19, 1999 and is headquartered in South San Francisco, CA. |
| Insider Trading |
Relationship |
Date |
Transaction |
Cost |
#Shares |
Value ($) |
#Shares Total |
SEC Form 4 |
| Casdin Partners Master Fund, L | Director | May 17 '24 | Buy | 2.56 | 352,072 | 902,044 | 45,375,821 | May 17 08:11 PM | | Casdin Partners Master Fund, L | Director | May 16 '24 | Buy | 2.54 | 500,000 | 1,270,950 | 45,023,749 | May 17 08:11 PM | | Black Jeffrey G. | SVP & Chief Financial Officer | May 15 '24 | Option Exercise | 0.00 | 52,631 | 0 | 138,615 | May 16 09:07 PM | | Casdin Partners Master Fund, L | Director | May 15 '24 | Buy | 2.57 | 500,000 | 1,282,550 | 44,523,749 | May 17 08:11 PM | | Egholm Michael | President & CEO | Apr 04 '24 | Option Exercise | 0.00 | 196,512 | 0 | 422,030 | Apr 05 06:59 PM |
|
|
|
