 |
| Market Cap | 38.26M | EPS (ttm) | 2.53 |
| P/E | 5.84 | EPS this Y | 840.10% |
| Forward P/E | - | EPS next Y | - |
| PEG | - | EPS past 5Y | 47.80% |
| P/S | 5.24 | EPS next 5Y | - |
| P/B | 0.63 | EPS Q/Q | 240.10% |
| Dividend | 6.68% | Sales Q/Q | 11.80% |
| Insider Own | 76.03% | Inst Own | 3.40% |
| Insider Trans | 0.15% | Inst Trans | 1.15% |
| Short Float | 0.32% | Earnings | May 13/b |
| Analyst Recom | - | Target Price | - |
| Avg Volume | 1.34K | 52W Range | 12.17 - 14.51 |
|
|
|
|
Rand Capital Corporation is a business development company specializing in subordinated debt with warrants or preferred equity and venture capital investments. Within private equity, the firm specializing in capital growth and lower middle market investments. Within venture capital, it specializing in early to late-stage private businesses. It does not prefer to invest in real estate sector. It prefers to invest in software, professional services, manufacturing, consumer, healthcare, automotive and public d stocks. It prefers to invest in East or Midwest U.S. operations sectors. It typically invests between $0.75 million and $5 million with initial target size of $1.5 million. It seeks to invest in companies having more than $2 million in revenue or having excess of $1.5 million and up to $5 million in EBITDA. It prefers to be a minority stake and seeks to take a Board seat in its portfolio companies. It typically holds its investments for a period up to five years. |
| Insider Trading |
Relationship |
Date |
Transaction |
Cost |
#Shares |
Value ($) |
#Shares Total |
SEC Form 4 |
| Godley Benjamin E | Director | Mar 12 '24 | Buy | 13.95 | 1,965 | 27,412 | 25,000 | Mar 13 05:00 PM | | Godley Benjamin E | Director | Mar 07 '24 | Buy | 13.99 | 183 | 2,560 | 23,035 | Mar 08 05:00 PM | | Godley Benjamin E | Director | Mar 06 '24 | Buy | 13.95 | 852 | 11,885 | 22,852 | Mar 08 05:00 PM | | Godley Benjamin E | Director | Aug 17 '23 | Buy | 13.15 | 100 | 1,315 | 22,000 | Aug 18 04:30 PM | | Godley Benjamin E | Director | Aug 16 '23 | Buy | 12.98 | 1,900 | 24,662 | 21,900 | Aug 18 04:30 PM |
|
|
 |
 |
| Market Cap | 369.26M | EPS (ttm) | -1.89 |
| P/E | - | EPS this Y | 13.97% |
| Forward P/E | - | EPS next Y | -13.50% |
| PEG | - | EPS past 5Y | -25.53% |
| P/S | 17.54 | EPS next 5Y | - |
| P/B | 2.54 | EPS Q/Q | 73.41% |
| Dividend | - | Sales Q/Q | 132.99% |
| Insider Own | 16.42% | Inst Own | 59.67% |
| Insider Trans | 0.45% | Inst Trans | -0.36% |
| Short Float | 1.03% | Earnings | May 13/b |
| Analyst Recom | 1.17 | Target Price | 12.00 |
| Avg Volume | 210.48K | 52W Range | 1.93 - 9.09 |
|
|
| May-13-24 | Initiated |
Needham |
Buy |
$11 |
|
|
|
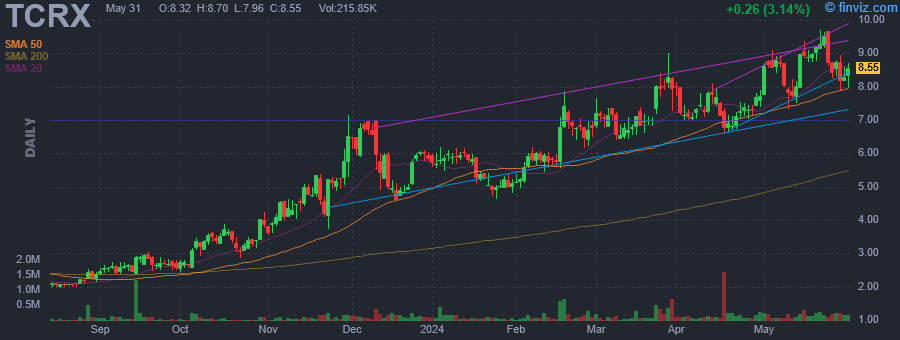
TScan Therapeutics, Inc. discovers and develops transformative T cell therapies (TCR-T) to treat liquid cancers, solid tumors and other serious diseases. Its platform identifies previously uncharacterized, clinically-derived shared T cell antigens and all off-target TCR interactions, to enable the development of efficacious TCR-Ts. The company was founded by Christoph H. Westphal, Stephen Elledge, Lea Hachigian, and Tomasz Kula in 2018 and is headquartered in Boston, MA. |
| Insider Trading |
Relationship |
Date |
Transaction |
Cost |
#Shares |
Value ($) |
#Shares Total |
SEC Form 4 |
| BARBERICH TIMOTHY J | Director | Dec 19 '23 | Buy | 4.97 | 317 | 1,575 | 67,027 | Dec 21 05:00 PM | | BARBERICH TIMOTHY J | Director | Dec 18 '23 | Buy | 4.89 | 28,830 | 140,881 | 66,710 | Dec 21 05:00 PM | | Klencke Barbara | Director | Dec 14 '23 | Buy | 5.08 | 5,000 | 25,400 | 30,000 | Dec 18 06:01 PM | | BARBERICH TIMOTHY J | Director | Jun 02 '23 | Buy | 2.63 | 37,880 | 99,564 | 37,880 | Jun 06 07:53 PM | | Lynx1 Capital Management LP | 10% Owner | May 31 '23 | Sale | 2.52 | 25,400 | 63,952 | 5,224,600 | Jun 02 05:35 PM |
|
|
|
 |
| Market Cap | 380.91M | EPS (ttm) | -1.27 |
| P/E | - | EPS this Y | -7.77% |
| Forward P/E | - | EPS next Y | -1.12% |
| PEG | - | EPS past 5Y | -12.40% |
| P/S | - | EPS next 5Y | - |
| P/B | 1.49 | EPS Q/Q | -0.45% |
| Dividend | - | Sales Q/Q | - |
| Insider Own | 36.39% | Inst Own | 77.42% |
| Insider Trans | -1.76% | Inst Trans | 32.54% |
| Short Float | 10.91% | Earnings | May 13/b |
| Analyst Recom | 1.50 | Target Price | 14.21 |
| Avg Volume | 946.52K | 52W Range | 3.26 - 13.23 |
|
|
|
|
Terns Pharmaceuticals, Inc. is a clinical-stage biopharmaceutical company, which engages in developing a portfolio of small-molecule single-agent and combination therapy candidates for the treatment of non-alcoholic steatohepatitis, or NASH, and other chronic liver diseases. The firm's pipeline includes clinical stage development programs, including a FXR agonist, a VAP-1 inhibitor, a THR-ß agonist, and a preclinical GLP-1 receptor agonist program. The company was founded by Randall L. Halcomb, Martijn Fenaux, and Weidong Zhong in 2017 and is headquartered in Foster City, CA. |
| Insider Trading |
Relationship |
Date |
Transaction |
Cost |
#Shares |
Value ($) |
#Shares Total |
SEC Form 4 |
| Vivo Opportunity, LLC | 10% Owner | Apr 03 '24 | Sale | 6.20 | 138,066 | 856,009 | 268,573 | Apr 03 08:47 PM | | Vivo Opportunity, LLC | 10% Owner | Apr 02 '24 | Sale | 6.65 | 101,480 | 674,842 | 272,722 | Apr 03 08:47 PM | | Vivo Opportunity, LLC | 10% Owner | Apr 01 '24 | Sale | 6.99 | 181,117 | 1,266,008 | 275,772 | Apr 03 08:47 PM |
|
|
| |
 |
| Market Cap | 10.36B | EPS (ttm) | 0.44 |
| P/E | 33.47 | EPS this Y | 31.08% |
| Forward P/E | 21.79 | EPS next Y | 20.49% |
| PEG | 2.25 | EPS past 5Y | 19.83% |
| P/S | 2.64 | EPS next 5Y | 14.89% |
| P/B | 1.31 | EPS Q/Q | 16.16% |
| Dividend | - | Sales Q/Q | -8.61% |
| Insider Own | 1.02% | Inst Own | 62.68% |
| Insider Trans | 0.00% | Inst Trans | -1.64% |
| Short Float | 3.73% | Earnings | May 13/b |
| Analyst Recom | 1.41 | Target Price | 13.36 |
| Avg Volume | 7.85M | 52W Range | 5.70 - 13.66 |
|
|
|
|
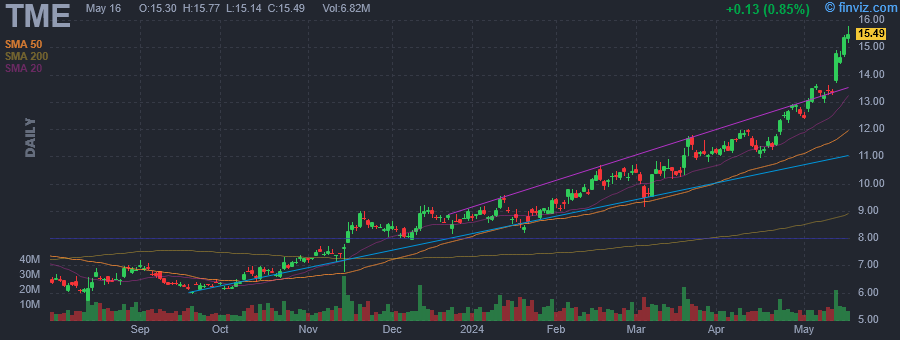
Tencent Music Entertainment Group engages in the business of operating online music entertainment platforms to provide music streaming, online karaoke, and live streaming services. Its product brands include QQ Music, Kugou Music, Kuwo Music, and WeSing. The company was founded on June 6, 2012 and is headquartered in Shenzhen, China. |
|
|
 |
| Market Cap | 370.39M | EPS (ttm) | -6.50 |
| P/E | - | EPS this Y | 68.79% |
| Forward P/E | - | EPS next Y | -8.15% |
| PEG | - | EPS past 5Y | -19.23% |
| P/S | - | EPS next 5Y | - |
| P/B | 1.43 | EPS Q/Q | 89.73% |
| Dividend | - | Sales Q/Q | - |
| Insider Own | 39.73% | Inst Own | 42.68% |
| Insider Trans | 1.04% | Inst Trans | -7.46% |
| Short Float | 20.11% | Earnings | May 13/b |
| Analyst Recom | 1.00 | Target Price | 58.33 |
| Avg Volume | 431.81K | 52W Range | 9.18 - 48.31 |
|
|
|
|
Tourmaline Bio, Inc. is a late-stage clinical biotechnology company, which engages in the development of medicines for patients with life-altering immune diseases. It offers the TOUR006. The company was founded by Sandeep Kulkarni on September 17, 2021 and is headquartered in New York, NY. |
| Insider Trading |
Relationship |
Date |
Transaction |
Cost |
#Shares |
Value ($) |
#Shares Total |
SEC Form 4 |
| MCDADE MARK | Director | Jan 29 '24 | Buy | 32.50 | 100,000 | 3,250,000 | 448,431 | Jan 31 04:26 PM | | Kulkarni Sandeep Chidambar | CEO | Nov 17 '23 | Buy | 16.99 | 4,000 | 67,960 | 729,735 | Nov 20 06:15 PM | | Thiara Parvinder | Director | Nov 17 '23 | Buy | 17.31 | 1,000 | 17,310 | 83,782 | Nov 20 06:14 PM | | Castelein Caley | Director | Oct 27 '23 | Buy | 14.55 | 15,800 | 229,890 | 516,519 | Oct 27 05:43 PM | | Kulkarni Sandeep Chidambar | CEO | Oct 26 '23 | Buy | 12.25 | 5,000 | 61,250 | 725,735 | Oct 26 05:34 PM |
|
|
| |
 |
| Market Cap | 472.22M | EPS (ttm) | -3.72 |
| P/E | - | EPS this Y | -1.97% |
| Forward P/E | - | EPS next Y | 27.12% |
| PEG | - | EPS past 5Y | 5.89% |
| P/S | 5.71 | EPS next 5Y | - |
| P/B | - | EPS Q/Q | 41.19% |
| Dividend | - | Sales Q/Q | 30.06% |
| Insider Own | 15.70% | Inst Own | 71.62% |
| Insider Trans | -0.37% | Inst Trans | -0.53% |
| Short Float | 14.55% | Earnings | May 13/b |
| Analyst Recom | 1.40 | Target Price | 38.50 |
| Avg Volume | 340.43K | 52W Range | 8.69 - 24.13 |
|
|
|
|
UroGen Pharma Ltd. is a biopharmaceutical company, which engages in developing and commercializing innovative solutions that treat urothelial and specialty cancers. It also focuses on developing RTGel reverse-thermal hydrogel, a proprietary sustained release and hydrogel-based platform technology. The company was founded by Asher Holzer in 2004 and is headquartered in Princeton, NJ. |
| Insider Trading |
Relationship |
Date |
Transaction |
Cost |
#Shares |
Value ($) |
#Shares Total |
SEC Form 4 |
| Schoenberg Mark | Chief Medical Officer | Mar 18 '24 | Sale | 14.05 | 12,000 | 168,600 | 139,437 | Mar 20 04:38 PM | | Smith Jason Drew | General Counsel | Jan 31 '24 | Sale | 15.74 | 4,993 | 78,590 | 18,824 | Feb 02 07:12 PM | | Schoenberg Mark | Chief Medical Officer | Jan 31 '24 | Sale | 15.74 | 3,789 | 59,639 | 149,423 | Feb 02 07:07 PM | | Smith Jason Drew | General Counsel | Aug 31 '23 | Sale | 18.01 | 3,800 | 68,438 | 18,407 | Sep 05 04:28 PM |
|
|
|
 |
| Market Cap | 405.54M | EPS (ttm) | -1.46 |
| P/E | - | EPS this Y | -4.29% |
| Forward P/E | - | EPS next Y | 47.69% |
| PEG | - | EPS past 5Y | -0.97% |
| P/S | 79.21 | EPS next 5Y | - |
| P/B | 20.52 | EPS Q/Q | -268.07% |
| Dividend | - | Sales Q/Q | 2823.53% |
| Insider Own | 39.25% | Inst Own | 42.02% |
| Insider Trans | 13.06% | Inst Trans | -9.35% |
| Short Float | 14.06% | Earnings | May 13/b |
| Analyst Recom | 1.00 | Target Price | 15.00 |
| Avg Volume | 162.02K | 52W Range | 2.86 - 8.17 |
|
|
|
|
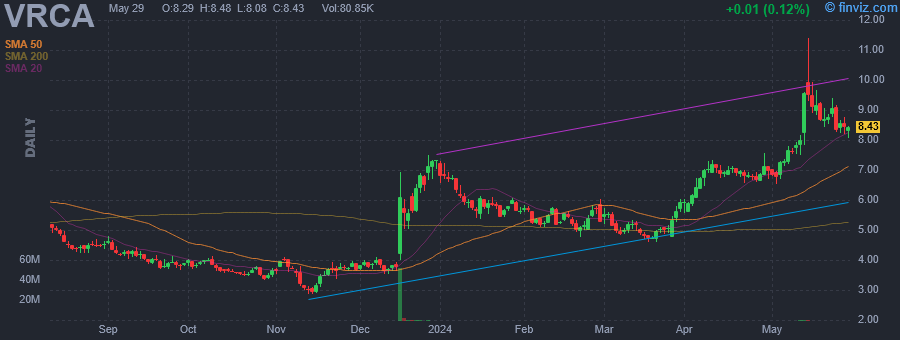
Verrica Pharmaceuticals, Inc. is a dermatology therapeutics company, which engages in identifying, developing, and commercializing pharmaceutical products for the treatment of skin diseases. Its products include Pipeline VP-102, Pipeline VP-103, and Pipeline VP-315. The company was founded by Matthew Davidson on July 3, 2013 and is headquartered in West Chester, PA. |
| Insider Trading |
Relationship |
Date |
Transaction |
Cost |
#Shares |
Value ($) |
#Shares Total |
SEC Form 4 |
| PERCEPTIVE ADVISORS LLC | 10% Owner | Dec 29 '23 | Buy | 7.24 | 115,774 | 838,204 | 7,099,182 | Dec 29 05:27 PM | | PERCEPTIVE ADVISORS LLC | 10% Owner | Dec 28 '23 | Buy | 7.08 | 126,116 | 892,901 | 6,983,408 | Dec 29 05:27 PM | | PERCEPTIVE ADVISORS LLC | 10% Owner | Dec 27 '23 | Buy | 7.20 | 79,726 | 574,027 | 6,857,292 | Dec 29 05:27 PM | | PERCEPTIVE ADVISORS LLC | 10% Owner | Dec 26 '23 | Buy | 6.49 | 54,652 | 354,691 | 6,777,566 | Dec 26 07:21 PM | | PERCEPTIVE ADVISORS LLC | 10% Owner | Dec 22 '23 | Buy | 6.67 | 250,000 | 1,667,500 | 6,722,914 | Dec 26 07:21 PM |
|
|
| |
 |
| Market Cap | 374.53M | EPS (ttm) | 0.59 |
| P/E | 18.96 | EPS this Y | 101.77% |
| Forward P/E | 3.63 | EPS next Y | 47.14% |
| PEG | 1.33 | EPS past 5Y | - |
| P/S | 0.95 | EPS next 5Y | 14.30% |
| P/B | 0.80 | EPS Q/Q | -388.52% |
| Dividend | 1.50% | Sales Q/Q | 25.28% |
| Insider Own | 60.53% | Inst Own | 32.75% |
| Insider Trans | 0.00% | Inst Trans | 1.33% |
| Short Float | 0.18% | Earnings | May 13/b |
| Analyst Recom | 1.00 | Target Price | 24.76 |
| Avg Volume | 18.37K | 52W Range | 9.80 - 18.05 |
|
|
|
|
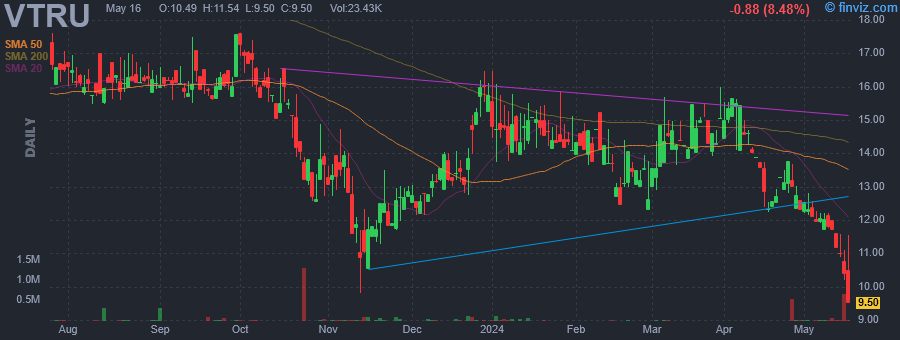
Vitru Ltd. operates as a pure-player in the post-secondary digital education market. The firm provides a complete pedagogical ecosystem focused on hybrid distance learning experience for undergraduates and continuing education students. It operates through the following segments: Digital education undergraduate courses, Continuing education courses and On-campus undergraduate courses. The Digital education undergraduate courses segment offers educational content and support via internet and mobile devices and its portfolio of courses is composed mainly of pedagogy, business administration, accounting, physical education, vocational education, engineering and health-related courses. The Continuing education courses segment offers continuing education courses predominantly in pedagogy, finance and business and it offers courses in different versions like in a hybrid model, 100% online and on-campus. The On-campus undergraduate courses segment offers traditional on-campus undergraduate courses, including those that are currently not allowed to be offered through digital education, such as law and health-related courses, and others such as business administration, accounting, physical education, and engineering . The company was founded on March 5, 2020 and is headquartered in Florianopolis, Brazil. |
|
|
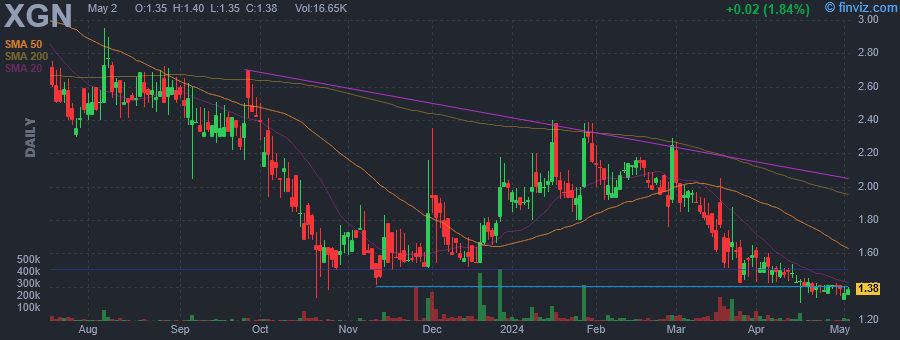 |
| Market Cap | 28.47M | EPS (ttm) | -1.34 |
| P/E | - | EPS this Y | 4.89% |
| Forward P/E | - | EPS next Y | 25.92% |
| PEG | - | EPS past 5Y | 2.69% |
| P/S | 0.54 | EPS next 5Y | - |
| P/B | 1.23 | EPS Q/Q | 62.57% |
| Dividend | - | Sales Q/Q | 7.23% |
| Insider Own | 53.72% | Inst Own | 37.64% |
| Insider Trans | -0.21% | Inst Trans | -0.83% |
| Short Float | 0.05% | Earnings | May 13/b |
| Analyst Recom | 1.33 | Target Price | 5.50 |
| Avg Volume | 33.58K | 52W Range | 1.30 - 3.92 |
|
|
|
|
Exagen, Inc. is a commercial-stage diagnostics company, which engages in transforming the care continuum for patients suffering from debilitating and chronic autoimmune diseases by enabling timely differential diagnosis and optimizing therapeutic intervention. It operates under the Avise brand. The company was founded by Waneta C. Tuttle and Cole Harris in 2002 and is headquartered in Vista, CA. |
| Insider Trading |
Relationship |
Date |
Transaction |
Cost |
#Shares |
Value ($) |
#Shares Total |
SEC Form 4 |
| Adawi Kamal | CFO and Corporate Secretary | Mar 04 '24 | Sale | 1.91 | 12,784 | 24,407 | 243,749 | Mar 06 04:05 PM | | Adawi Kamal | CFO and Corporate Secretary | Feb 06 '24 | Sale | 1.95 | 6,738 | 13,133 | 181,533 | Feb 08 04:05 PM | | ABALLI JOHN | President and CEO | Oct 17 '23 | Sale | 1.75 | 33,819 | 59,018 | 415,984 | Oct 18 04:05 PM | | TULLIS JAMES L L | 10% Owner | Jun 15 '23 | Buy | 3.11 | 167 | 519 | 1,515,839 | Jun 20 05:04 PM |
|
|
|
