 |
| Market Cap | 38.77M | EPS (ttm) | -0.76 |
| P/E | - | EPS this Y | - |
| Forward P/E | - | EPS next Y | - |
| PEG | - | EPS past 5Y | 52.23% |
| P/S | 1.48 | EPS next 5Y | - |
| P/B | 1.33 | EPS Q/Q | 6.32% |
| Dividend | - | Sales Q/Q | 89.74% |
| Insider Own | 21.65% | Inst Own | 8.50% |
| Insider Trans | 0.00% | Inst Trans | - |
| Short Float | 0.34% | Earnings | May 14/b |
| Analyst Recom | 1.00 | Target Price | 1.86 |
| Avg Volume | 99.71K | 52W Range | 0.82 - 2.54 |
|
|
|
|
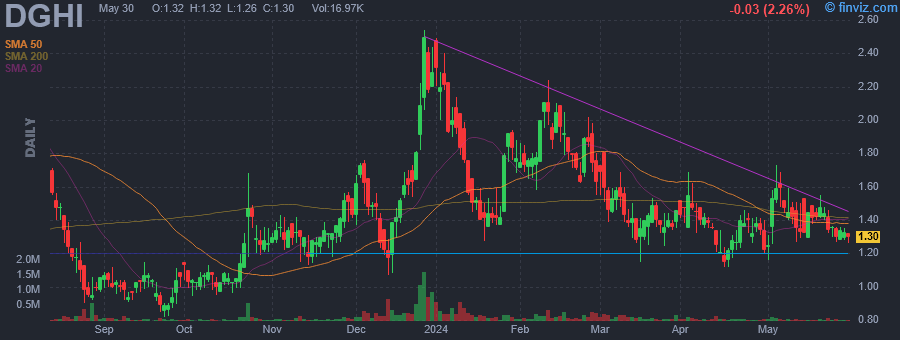
Digihost Technology, Inc. is a block chain technology company, which engages in crypto currency mining. It focuses on validation through mining, hosting solutions, and blockchain software solutions. The company was founded on February 18, 2017 and is headquartered in Toronto, Canada. |
|
 |
 |
| Market Cap | 261.90M | EPS (ttm) | -0.59 |
| P/E | - | EPS this Y | -31.33% |
| Forward P/E | - | EPS next Y | -32.74% |
| PEG | - | EPS past 5Y | 25.04% |
| P/S | - | EPS next 5Y | - |
| P/B | 1.86 | EPS Q/Q | 11.63% |
| Dividend | - | Sales Q/Q | - |
| Insider Own | 2.24% | Inst Own | 78.59% |
| Insider Trans | 3.17% | Inst Trans | -11.39% |
| Short Float | 2.14% | Earnings | May 14/b |
| Analyst Recom | 1.00 | Target Price | 19.00 |
| Avg Volume | 72.43K | 52W Range | 2.58 - 11.67 |
|
|
|
|
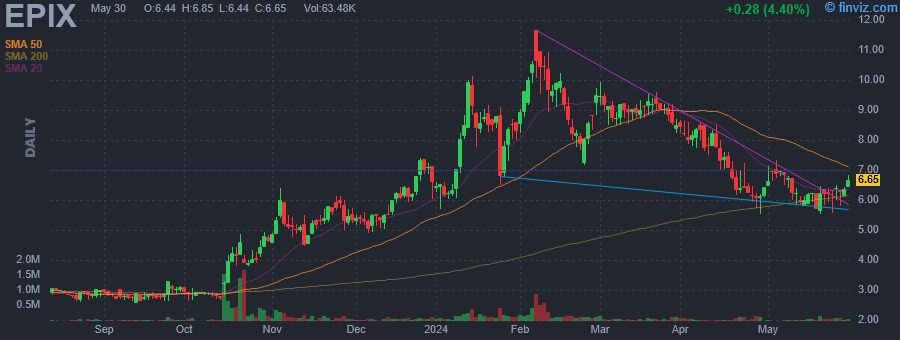
ESSA Pharma, Inc. is a clinical stage pharmaceutical company. It engages in the business of developing small molecule drugs for the treatment of prostate cancer. The company was founded by Marianne D. Sadar and Raymond J. Andersen on January 6, 2009 and is headquartered in Vancouver, Canada. |
| Insider Trading |
Relationship |
Date |
Transaction |
Cost |
#Shares |
Value ($) |
#Shares Total |
SEC Form 4 |
| Virsik Peter | Chief Operating Officer | May 06 '24 | Sale | 6.95 | 694 | 4,823 | 11,246 | May 06 05:17 PM | | Glickman Richard M | Director | Apr 24 '24 | Option Exercise | 4.90 | 3,750 | 18,375 | 43,240 | Apr 25 10:35 AM | | Virsik Peter | Chief Operating Officer | Apr 05 '24 | Sale | 7.94 | 694 | 5,510 | 11,940 | Apr 05 06:16 PM | | Virsik Peter | Chief Operating Officer | Mar 05 '24 | Sale | 8.98 | 694 | 6,232 | 12,634 | Mar 05 06:50 PM | | Virsik Peter | Chief Operating Officer | Feb 06 '24 | Option Exercise | 3.23 | 72,782 | 235,086 | 86,110 | Feb 07 11:29 AM |
|
|
|
 |
| Market Cap | 199.46M | EPS (ttm) | -0.60 |
| P/E | - | EPS this Y | 150.42% |
| Forward P/E | 7.53 | EPS next Y | 223.31% |
| PEG | - | EPS past 5Y | -2.95% |
| P/S | 9.39 | EPS next 5Y | - |
| P/B | - | EPS Q/Q | 61.59% |
| Dividend | - | Sales Q/Q | 534.20% |
| Insider Own | 14.60% | Inst Own | 56.27% |
| Insider Trans | -7.72% | Inst Trans | 0.73% |
| Short Float | 7.84% | Earnings | May 14/b |
| Analyst Recom | 1.17 | Target Price | 17.37 |
| Avg Volume | 131.50K | 52W Range | 6.30 - 11.92 |
|
|
|
|
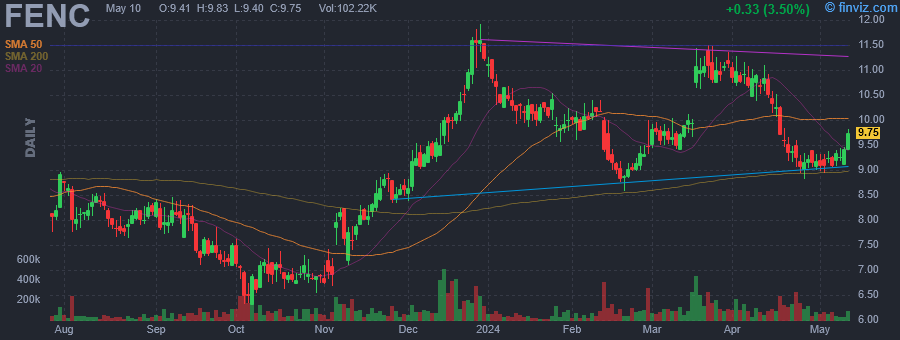
Fennec Pharmaceuticals, Inc. operates as a biopharmaceutical company. It engages in the development of sodium thiosulfate for the prevention of ototoxicity from cisplatin in pediatric cancer patients. The company was founded by Orest W. Blaschuk on September 3, 1996 and is headquartered in Durham, NC. |
| Insider Trading |
Relationship |
Date |
Transaction |
Cost |
#Shares |
Value ($) |
#Shares Total |
SEC Form 4 |
| Raykov Rosty | CHIEF EXECUTIVE OFFICER | May 01 '24 | Sale | 9.11 | 2,431 | 22,152 | 187,471 | May 02 04:59 PM | | Haigh Adrian | CHIEF OPERATING OFFICER | Apr 22 '24 | Option Exercise | 2.31 | 22,223 | 51,335 | 22,223 | Apr 22 07:34 PM | | Haigh Adrian | CHIEF OPERATING OFFICER | Apr 22 '24 | Sale | 9.32 | 22,223 | 207,029 | 0 | Apr 22 07:34 PM | | Haigh Adrian | CHIEF OPERATING OFFICER | Apr 19 '24 | Option Exercise | 2.31 | 22,222 | 51,333 | 22,222 | Apr 22 07:34 PM | | Haigh Adrian | CHIEF OPERATING OFFICER | Apr 19 '24 | Sale | 9.34 | 22,222 | 207,442 | 0 | Apr 22 07:34 PM |
|
|
| |
 |
| Market Cap | 36.15B | EPS (ttm) | -0.35 |
| P/E | - | EPS this Y | 82.37% |
| Forward P/E | 23.09 | EPS next Y | 37.76% |
| PEG | - | EPS past 5Y | - |
| P/S | 3.05 | EPS next 5Y | 32.64% |
| P/B | 2.80 | EPS Q/Q | - |
| Dividend | 0.23% | Sales Q/Q | 16.82% |
| Insider Own | 0.08% | Inst Own | 66.07% |
| Insider Trans | 0.00% | Inst Trans | - |
| Short Float | 0.27% | Earnings | May 14/b |
| Analyst Recom | 1.30 | Target Price | 245.61 |
| Avg Volume | 274.70K | 52W Range | 148.00 - 226.40 |
|
|
|
|
Flutter Entertainment Plc engages in the business of online betting and gaming. It operates through the following segments: UK and Ireland, Australia, International, and US. The UK and Ireland segment includes the operations of Sky Betting and Gaming, Paddy Power, Betfair, and tombola. The Australia segment focuses on sports betting services provided to Australian customers online. The International segment relates to poker, casino, rummy, lottery, and sports betting. The US segment includes sports betting, daily fantasy sports, and gaming services. The company was founded in 1988 and is headquartered in Dublin, Ireland. |
|
|
 |
| Market Cap | 45.12M | EPS (ttm) | -1.71 |
| P/E | - | EPS this Y | 30.47% |
| Forward P/E | - | EPS next Y | 4.54% |
| PEG | - | EPS past 5Y | -79.01% |
| P/S | 752.08 | EPS next 5Y | - |
| P/B | 3.22 | EPS Q/Q | 25.90% |
| Dividend | - | Sales Q/Q | - |
| Insider Own | 16.40% | Inst Own | 10.30% |
| Insider Trans | 0.95% | Inst Trans | 8.29% |
| Short Float | 1.02% | Earnings | May 14/b |
| Analyst Recom | 1.00 | Target Price | 8.80 |
| Avg Volume | 119.60K | 52W Range | 2.00 - 5.33 |
|
|
|
|
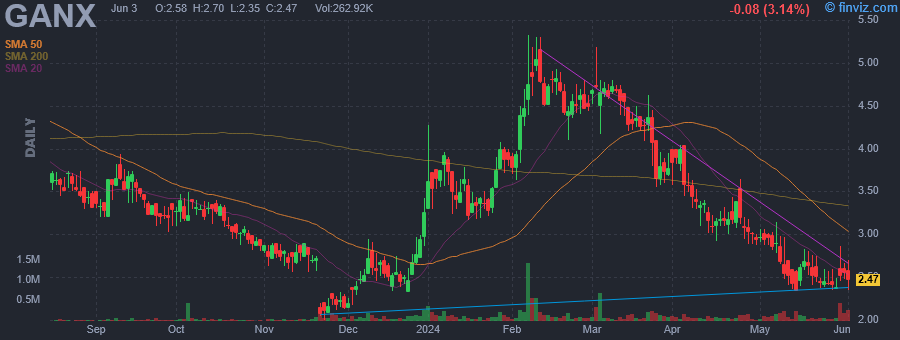
Gain Therapeutics, Inc. is a redefining drug discovery company, which identifies and optimizes allosteric binding sites that never before targeted. Its See-Tx target identification platform uses the published 3D structure of enzymes and a proprietary computational technology to discover new allosteric binding sites and predict their druggability. The firm is also unlocking new treatment options to treat disorders characterized by protein misfolding. The company was founded by Khalid Islam in 2017 and is headquartered in Bethesda, MD. |
| Insider Trading |
Relationship |
Date |
Transaction |
Cost |
#Shares |
Value ($) |
#Shares Total |
SEC Form 4 |
| Riley Jeffrey Scott | Director | Mar 28 '24 | Buy | 3.86 | 30,000 | 115,770 | 30,000 | Apr 01 04:01 PM | | Alder Matthias | Chief Executive Officer | Dec 21 '23 | Sale | 2.46 | 206 | 507 | 5,286 | Dec 22 04:17 PM | | Alder Matthias | Chief Executive Officer | Dec 07 '23 | Sale | 2.50 | 1,820 | 4,550 | 4,855 | Dec 14 04:01 PM |
|
|
| |
 |
| Market Cap | 3.42B | EPS (ttm) | 0.18 |
| P/E | 53.00 | EPS this Y | 87.94% |
| Forward P/E | 12.34 | EPS next Y | 82.87% |
| PEG | - | EPS past 5Y | -8.17% |
| P/S | 2.03 | EPS next 5Y | - |
| P/B | 1.63 | EPS Q/Q | 232.13% |
| Dividend | 0.11% | Sales Q/Q | 91.71% |
| Insider Own | 0.23% | Inst Own | 59.93% |
| Insider Trans | 0.00% | Inst Trans | 1.51% |
| Short Float | 1.62% | Earnings | May 14/b |
| Analyst Recom | 1.40 | Target Price | 9.51 |
| Avg Volume | 2.67M | 52W Range | 3.94 - 8.96 |
|
|
|
|
Hudbay Minerals, Inc. operates as a mining company. The firm engages in the production of copper concentrate, molybdenum concentrate and zinc metal. It focuses on the discovery, production and marketing of base and precious metals. The company was founded on January 16, 1996 and is headquartered in Toronto, Canada. |
|
|
 |
| Market Cap | 335.93B | EPS (ttm) | 15.10 |
| P/E | 22.45 | EPS this Y | 1.50% |
| Forward P/E | 20.79 | EPS next Y | 6.33% |
| PEG | 5.22 | EPS past 5Y | 9.21% |
| P/S | 2.20 | EPS next 5Y | 4.30% |
| P/B | 322.09 | EPS Q/Q | -14.68% |
| Dividend | 2.62% | Sales Q/Q | -2.92% |
| Insider Own | 0.23% | Inst Own | 72.60% |
| Insider Trans | -5.07% | Inst Trans | 0.42% |
| Short Float | 0.87% | Earnings | May 14/b |
| Analyst Recom | 2.08 | Target Price | 385.94 |
| Avg Volume | 3.52M | 52W Range | 274.26 - 396.87 |
|
|
|
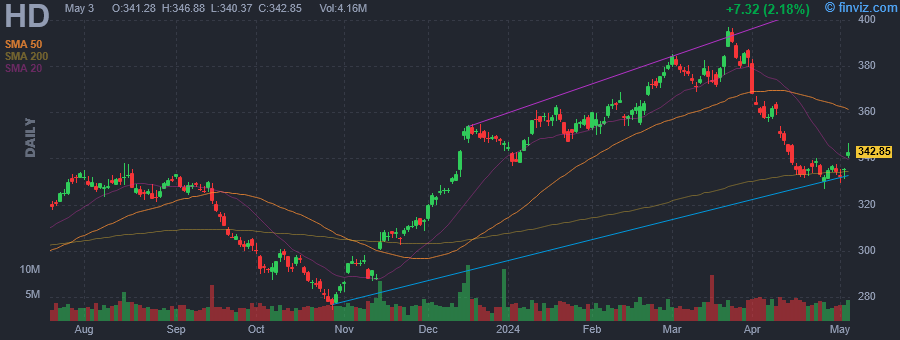
Today 01:06PM
|
These Stocks Are Moving the Most Today: GameStop, AMC, Home Depot, Alibaba, Plug Power, On Holding, Paysafe, and More
(Barrons.com) |
|
12:36PM
|
Truist Securities Adjusts Home Depot's Price Target to $406 From $417, Keeps Buy Rating
(MT Newswires) |
|
12:10PM
|
Home Depot is still well positioned despite Q1 miss: Fmr. CEO
(Yahoo Finance Video) |
|
12:09PM
|
Home Depot Stock Falls After Retailer's Sales Decline
(The Wall Street Journal) |
|
11:37AM
|
Home Depot Still Looks Sturdy
(The Wall Street Journal) |
|
11:25AM
|
Home Depot (HD) Q1 Earnings Surpass, Sales Miss Estimates
(Zacks) |
|
11:24AM
|
Biden's EV, tariff policies are 'ambiguous': Bob Nardelli
(Yahoo Finance Video) |
|
11:01AM
|
Home Depot earnings show signs of a consumer pullback
(Yahoo Finance) |
|
10:54AM
|
HD Stock Earnings: Home Depot Beats EPS, Misses Revenue for Q1 2024
(InvestorPlace) |
|
10:10AM
|
S&P 500 Giant Home Depot Sees Same-Store Sales Fall For Sixth Straight Quarter
(Investor's Business Daily) |
|
The Home Depot, Inc. engages in the sale of building materials and home improvement products. Its products include building materials, home improvement products, lawn and garden products and decor products. The firm operates through the following geographical segments: U.S., Canada and Mexico. It offers home improvement installation services, and tool and equipment rental. The company was founded by Bernard Marcus, Arthur M. Blank, Kenneth Gerald Langone and Pat Farrah on June 29, 1978, and is headquartered at Atlanta, GA. |
| Insider Trading |
Relationship |
Date |
Transaction |
Cost |
#Shares |
Value ($) |
#Shares Total |
SEC Form 4 |
| Decker Edward P. | Chair, President and CEO | Feb 22 '24 | Option Exercise | 116.15 | 35,987 | 4,179,890 | 143,718 | Feb 26 05:00 PM | | Campbell Ann Marie | Senior EVP | Feb 22 '24 | Option Exercise | 142.25 | 27,574 | 3,922,345 | 93,094 | Feb 26 05:02 PM | | Hourigan Timothy A. | EVP - Human Resources | Feb 22 '24 | Option Exercise | 116.15 | 8,996 | 1,044,885 | 84,795 | Feb 26 05:04 PM | | Decker Edward P. | Chair, President and CEO | Feb 22 '24 | Sale | 368.63 | 35,987 | 13,266,019 | 107,731 | Feb 26 05:00 PM | | Campbell Ann Marie | Senior EVP | Feb 22 '24 | Sale | 368.65 | 27,574 | 10,165,043 | 65,520 | Feb 26 05:02 PM |
|
|
| |
 |
| Market Cap | 43.04M | EPS (ttm) | -1.42 |
| P/E | - | EPS this Y | 22.03% |
| Forward P/E | - | EPS next Y | 20.84% |
| PEG | - | EPS past 5Y | -24.74% |
| P/S | 0.19 | EPS next 5Y | - |
| P/B | - | EPS Q/Q | 57.32% |
| Dividend | - | Sales Q/Q | -23.23% |
| Insider Own | 9.97% | Inst Own | 27.36% |
| Insider Trans | 0.00% | Inst Trans | -11.66% |
| Short Float | 2.85% | Earnings | May 14/b |
| Analyst Recom | 3.00 | Target Price | 1.02 |
| Avg Volume | 183.09K | 52W Range | 0.67 - 1.64 |
|
|
|
|
Hydrofarm Holdings Group, Inc. engages in the manufacture and distribution of controlled environment agriculture equipment and supplies. It offers lighting, atmospheric control, hydroponics, nutrients and additives, growing media, plant care and pest and disease control, seed starting and cloning, garden accessories, and food storage products. The firm operates through the U.S. and Canada geographical segments. The company was founded in 1977 and is headquartered in Shoemakersville, PA. |
| Insider Trading |
Relationship |
Date |
Transaction |
Cost |
#Shares |
Value ($) |
#Shares Total |
SEC Form 4 |
| Toler William Douglas | CEO and Chairman of the Board | May 16 '23 | Buy | 1.04 | 15,000 | 15,600 | 1,799,328 | May 17 06:30 PM | | Toler William Douglas | CEO and Chairman of the Board | May 15 '23 | Buy | 1.09 | 35,000 | 38,150 | 1,784,328 | May 17 06:30 PM |
|
|
|
 |
| Market Cap | 6.72M | EPS (ttm) | -1.15 |
| P/E | - | EPS this Y | 44.86% |
| Forward P/E | - | EPS next Y | 84.75% |
| PEG | - | EPS past 5Y | -51.27% |
| P/S | 1.47 | EPS next 5Y | - |
| P/B | 1.79 | EPS Q/Q | 62.07% |
| Dividend | - | Sales Q/Q | 13.36% |
| Insider Own | 15.80% | Inst Own | 15.38% |
| Insider Trans | 0.00% | Inst Trans | - |
| Short Float | 1.64% | Earnings | May 14/b |
| Analyst Recom | 1.00 | Target Price | 4.00 |
| Avg Volume | 422.17K | 52W Range | 0.66 - 3.50 |
|
|
|
|
T Stamp, Inc. engages in the provision of identity verification services to facilitate Internet-mediated economic and social transactions. It guards against identity theft and friendly-fraud by providing a secure digital token verifying the user's photograph, identity and trustworthiness. The company was founded by Gareth Genner, Andrew Gowasack, Catherine Lambert and Mike Lindenau in 2015 and is headquartered in Atlanta, GA. |
| Insider Trading |
Relationship |
Date |
Transaction |
Cost |
#Shares |
Value ($) |
#Shares Total |
SEC Form 4 |
| Ming Tracy | Financial Controller | Mar 05 '24 | Option Exercise | 0.00 | 3,399 | 0 | 16,729 | Apr 26 06:49 AM | | Valdes Alexander | Chief Financial Officer | Mar 05 '24 | Option Exercise | 0.00 | 3,495 | 0 | 78,631 | Apr 26 06:27 AM | | Gowasack Andrew Carl | President | Mar 05 '24 | Option Exercise | 0.00 | 4,333 | 0 | 258,808 | Apr 26 08:12 AM | | Genner Gareth Neville | Chief Executive Officer | Mar 05 '24 | Option Exercise | 0.00 | 2,839 | 0 | 172,302 | Apr 29 08:46 AM | | McClintock William | Director | Mar 05 '24 | Option Exercise | 0.00 | 9,252 | 0 | 22,968 | Apr 29 12:23 PM |
|
|
|
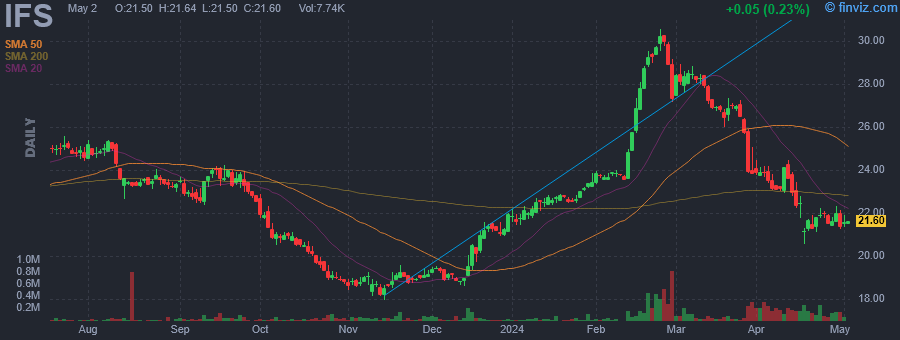 |
| Market Cap | 2.53B | EPS (ttm) | 2.48 |
| P/E | 8.82 | EPS this Y | 21.81% |
| Forward P/E | 5.20 | EPS next Y | 38.36% |
| PEG | 1.19 | EPS past 5Y | -3.56% |
| P/S | 0.97 | EPS next 5Y | 7.40% |
| P/B | 0.94 | EPS Q/Q | -26.67% |
| Dividend | 4.82% | Sales Q/Q | -32.40% |
| Insider Own | 70.62% | Inst Own | 15.85% |
| Insider Trans | 0.94% | Inst Trans | 0.03% |
| Short Float | 0.27% | Earnings | May 14/b |
| Analyst Recom | 1.57 | Target Price | 30.70 |
| Avg Volume | 162.04K | 52W Range | 17.94 - 30.59 |
|
|
|
|
Intercorp Financial Services, Inc. is a holding company, which engages in the provision of financial services. Through its subsidiaries it operates through the following business segments: Banking, Insurance, and Wealth Management. The Banking segment provides a range of retail banking and commercial banking products, and services to individuals, large companies, and small and medium enterprises. The Insurance segment offers retirement, savings, life, unemployment, and other insurance products mainly to retail customers. The Wealth Management segment comprises wealth management, private banking, financing, brokerage, advisory, and other investment services mainly to high net worth individuals. The company was founded on September 19, 2006 and is headquartered in Lima, Peru. |
| Insider Trading |
Relationship |
Date |
Transaction |
Cost |
#Shares |
Value ($) |
#Shares Total |
SEC Form 4 |
| INTERCORP PERU LTD | 10% Owner | Mar 26 '24 | Buy | 19.60 | 437,369 | 8,572,433 | 1,253,535 | Mar 26 04:30 PM | | INTERCORP PERU LTD | 10% Owner | Dec 20 '23 | Buy | 20.00 | 321,466 | 6,429,325 | 816,166 | Dec 20 05:26 PM | | INTERCORP PERU LTD | 10% Owner | Nov 09 '23 | Buy | 20.00 | 482,199 | 9,643,987 | 494,699 | Nov 09 04:24 PM |
|
|
|
