 |
| Market Cap | 665.51M | EPS (ttm) | 1.75 |
| P/E | 7.04 | EPS this Y | 96.60% |
| Forward P/E | 7.58 | EPS next Y | -6.32% |
| PEG | - | EPS past 5Y | 26.00% |
| P/S | 2.65 | EPS next 5Y | - |
| P/B | 0.77 | EPS Q/Q | 434.80% |
| Dividend | 10.83% | Sales Q/Q | 13.20% |
| Insider Own | 0.30% | Inst Own | 29.00% |
| Insider Trans | 5.60% | Inst Trans | 52.40% |
| Short Float | 0.18% | Earnings | May 09/b |
| Analyst Recom | 3.00 | Target Price | 12.00 |
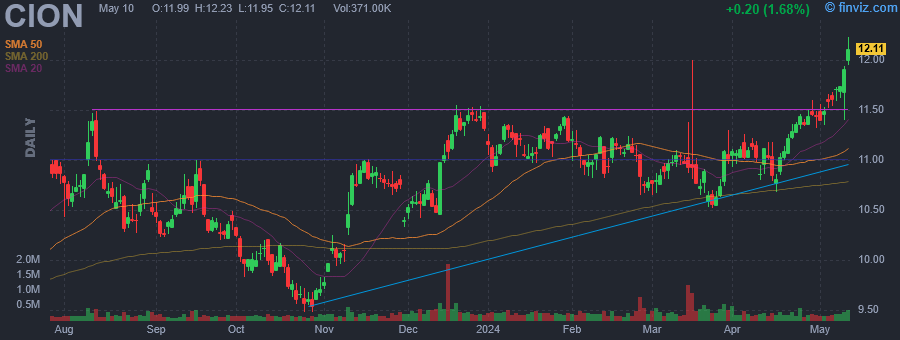
| Avg Volume | 305.11K | 52W Range | 8.96 - 12.54 |
|
|
|
|
CION Investment Corporation is a business development company. It specializes in investments in senior secured loans, including unitranche loans, First Lien, second lien loans, long-term subordinated loans, and mezzanine loans; equity interests such as warrants or options; and corporate bonds; and other debt securities in middle-market companies. The firm invests in growth capital, acquisitions, leveraged buyouts, market/product expansion, refinancing and recapitalization. The fund also invests up to 30 percent of their assets opportunistically in other types of investments, including the securities of larger public companies and foreign securities. It also makes investments in the secondary loan market. The fund does not invest in start-up companies, turnaround situations, or companies with speculative business plans. The fund prefers to invest in high tech industries, healthcare, pharmaceuticals, business services, media, chemicals, plastic, rubber, telecommunication, consumer services, advertising, printing and publishing, consumer goods, durables, diversified financials, and other industries. It also invests in homebuilding, restaurants, beverage and tobacco bars, broadcasting, distributors, Non-durable good distribution, food beverage and tobacco, energy, oil gas and consumables fuels, insurance, aerospace and defense, industrial machinery, paper and forest product machinery, information technology, metals and mining, and real estate. It primarily seeks to invest in the United States. The fund seeks to invest between $5 million and $50 million in companies with an EBITDA between $25 million and $75 million with average targeted hold of $25 million. It also purchases minority interests in the form of common or preferred equity in the target companies, typically in conjunction with its debt investments or through a co-investment with a financial sponsor. The fund seeks to exit its investments through an initial public offering of common stock, a merger, a sale, or other recapitalization. |
| Insider Trading |
Relationship |
Date |
Transaction |
Cost |
#Shares |
Value ($) |
#Shares Total |
SEC Form 4 |
| Reisner Michael A | Co-Chairman & Co-CEO | May 13 '24 | Buy | 12.27 | 407 | 4,994 | 44,160 | May 14 02:30 PM | | Pinero Eric A. | Chief Legal Officer | Apr 05 '24 | Buy | 11.11 | 450 | 5,000 | 7,136 | Apr 05 04:01 PM | | ROMAN STEPHEN | CCO & Secretary | Apr 01 '24 | Buy | 11.05 | 450 | 4,972 | 9,146 | Apr 01 02:23 PM | | Gatto Mark | Co-Chairman & Co-CEO | Mar 27 '24 | Buy | 11.02 | 1,150 | 12,673 | 1,000 | Mar 29 10:55 AM | | Reisner Michael A | Co-Chairman & Co-CEO | Mar 25 '24 | Buy | 10.65 | 469 | 4,995 | 43,753 | Mar 26 11:38 AM |
|
|
 |
 |
| Market Cap | 188.19M | EPS (ttm) | 2.05 |
| P/E | 11.36 | EPS this Y | -19.39% |
| Forward P/E | 14.28 | EPS next Y | -5.36% |
| PEG | - | EPS past 5Y | 2.21% |
| P/S | 1.86 | EPS next 5Y | - |
| P/B | 0.92 | EPS Q/Q | -14.29% |
| Dividend | 3.47% | Sales Q/Q | 20.40% |
| Insider Own | 4.64% | Inst Own | 24.81% |
| Insider Trans | 1.22% | Inst Trans | 1.55% |
| Short Float | 1.86% | Earnings | Apr 30/b |
| Analyst Recom | 3.00 | Target Price | 24.00 |
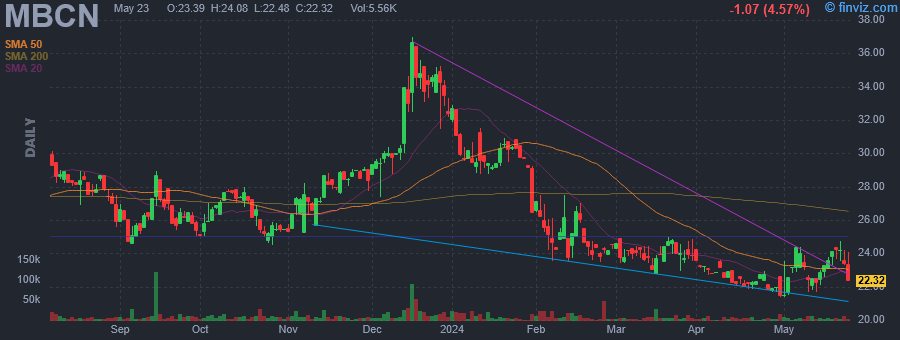
| Avg Volume | 8.28K | 52W Range | 21.36 - 37.00 |
|
|
|
|
Middlefield Banc Corp. is a holding company, which engages in the provision of personal and commercial banking solutions. It offers checking, savings, negotiable order of withdrawal accounts, money market accounts, time certificates of deposit, commercial loans, real estate loans, a variety of consumer loans, safe deposit facilities, and travelers' checks services. It also provides mortgage and investment services. The company was founded in 1988 and is headquartered in Middlefield, OH. |
| Insider Trading |
Relationship |
Date |
Transaction |
Cost |
#Shares |
Value ($) |
#Shares Total |
SEC Form 4 |
| Zimmerly Ronald Len Jr. | EVP/Chief Executive Officer | May 13 '24 | Buy | 22.47 | 1,000 | 22,470 | 35,876 | May 14 02:12 PM | | Wilson Thomas M | EVP-Chief Strategy Officer | May 09 '24 | Buy | 22.38 | 1,000 | 22,380 | 11,498 | May 09 04:56 PM | | Moeller Jennifer L | Director | May 09 '24 | Buy | 23.00 | 250 | 5,750 | 1,914 | May 09 05:34 PM | | Moeller Jennifer L | Director | Feb 14 '24 | Buy | 23.75 | 280 | 6,650 | 1,664 | Feb 14 12:51 PM | | Voinovich Michael C | Director | Feb 05 '24 | Buy | 25.75 | 1,000 | 25,750 | 9,253 | Feb 05 03:21 PM |
|
|
|
 |
| Market Cap | 390.02M | EPS (ttm) | 0.79 |
| P/E | 18.05 | EPS this Y | - |
| Forward P/E | - | EPS next Y | - |
| PEG | - | EPS past 5Y | - |
| P/S | 111.02 | EPS next 5Y | - |
| P/B | 0.88 | EPS Q/Q | - |
| Dividend | 7.08% | Sales Q/Q | 34.40% |
| Insider Own | - | Inst Own | 34.31% |
| Insider Trans | - | Inst Trans | - |
| Short Float | 0.21% | Earnings | - |
| Analyst Recom | - | Target Price | - |
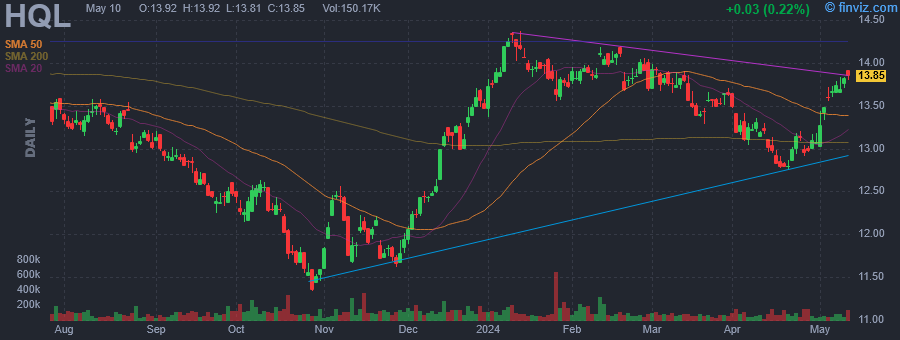
| Avg Volume | 85.95K | 52W Range | 11.34 - 14.37 |
|
|
|
|
Tekla Life Sciences Investors is a closed-ended equity mutual fund launched and managed by Tekla Capital Management LLC. The fund invests in public equity markets across the globe. It seeks to invest in stocks of companies operating in the life sciences sector, including the biotechnology, pharmaceutical, diagnostics, managed healthcare, medical equipment, hospitals, healthcare information technology and services, devices and supplies industries, and in agriculture and environmental management industries. The fund primarily invests in growth stocks of small cap companies. It employs fundamental analysis with a focus on factors such as market position for services or products, experience of business management, technological expertise, and the ability either to generate funds internally to finance growth or to secure outside sources of capital to create its portfolio. The fund benchmarks the performance of its portfolio against the NASDAQ Biotech Index and the S&P 500 Index. It was formerly known as H&Q Life Sciences Investors fund. Tekla Life Sciences Investors was formed on February 20, 1992 and is domiciled in the United States. |
| Insider Trading |
Relationship |
Date |
Transaction |
Cost |
#Shares |
Value ($) |
#Shares Total |
SEC Form 4 |
| Saba Capital Management, L.P. | 10% Owner | May 10 '24 | Buy | 13.86 | 57,862 | 801,967 | 3,215,825 | May 14 01:50 PM | | Saba Capital Management, L.P. | 10% Owner | May 09 '24 | Buy | 13.80 | 17,373 | 239,747 | 3,157,963 | May 10 10:31 AM | | Saba Capital Management, L.P. | 10% Owner | May 08 '24 | Buy | 13.70 | 10,986 | 150,508 | 3,140,590 | May 10 10:31 AM | | Saba Capital Management, L.P. | 10% Owner | May 07 '24 | Buy | 13.76 | 50,161 | 690,215 | 3,129,604 | May 07 05:07 PM | | Saba Capital Management, L.P. | 10% Owner | May 06 '24 | Buy | 13.62 | 10,713 | 145,911 | 3,079,443 | May 07 05:07 PM |
|
|
| |
 |
| Market Cap | 473.63M | EPS (ttm) | -0.66 |
| P/E | - | EPS this Y | - |
| Forward P/E | - | EPS next Y | - |
| PEG | - | EPS past 5Y | - |
| P/S | - | EPS next 5Y | - |
| P/B | - | EPS Q/Q | - |
| Dividend | 8.36% | Sales Q/Q | - |
| Insider Own | - | Inst Own | 40.44% |
| Insider Trans | - | Inst Trans | - |
| Short Float | 0.18% | Earnings | - |
| Analyst Recom | - | Target Price | - |
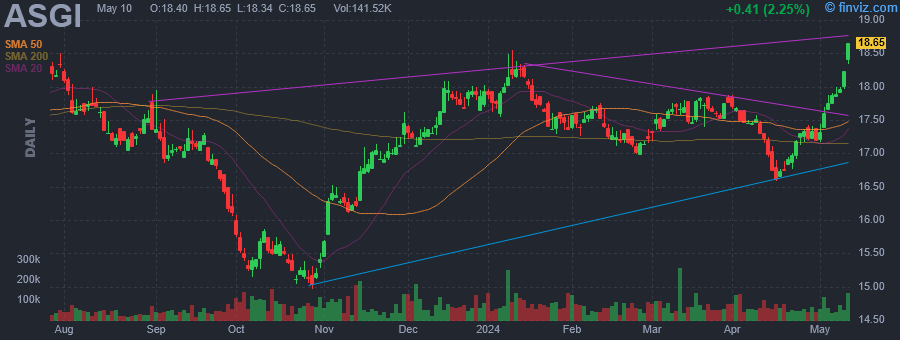
| Avg Volume | 75.99K | 52W Range | 14.96 - 19.14 |
|
|
|
|
Abrdn Global Infrastructure Income Fund seeks investment results that correspond generally to the price and yield performance, before fees and expenses, of the Northern Trust Real Assets Allocation IndexSM.Under normal circumstances, the fund will invest at least 80% of its total assets (exclusive of collateral held from securities lending) in the securities of the underlying index. The underlying index measures the performance of an optimized allocation to the underlying funds that is intended to provide exposures to certain real assets and minimize overall volatility of investment in the underlying funds. |
| Insider Trading |
Relationship |
Date |
Transaction |
Cost |
#Shares |
Value ($) |
#Shares Total |
SEC Form 4 |
| Saba Capital Management, L.P. | 10% Owner | May 10 '24 | Buy | 18.38 | 300 | 5,514 | 2,916,405 | May 14 01:48 PM | | Saba Capital Management, L.P. | 10% Owner | May 09 '24 | Buy | 18.05 | 1,533 | 27,671 | 2,916,105 | May 10 10:29 AM | | Saba Capital Management, L.P. | 10% Owner | May 08 '24 | Buy | 17.94 | 1,000 | 17,940 | 2,914,572 | May 10 10:29 AM | | Saba Capital Management, L.P. | 10% Owner | May 06 '24 | Buy | 17.84 | 8,397 | 149,802 | 2,913,572 | May 07 05:04 PM | | Saba Capital Management, L.P. | 10% Owner | May 03 '24 | Buy | 17.77 | 15,465 | 274,813 | 2,905,175 | May 07 05:04 PM |
|
|
|
 |
| Market Cap | 33.53M | EPS (ttm) | -0.24 |
| P/E | - | EPS this Y | - |
| Forward P/E | - | EPS next Y | - |
| PEG | - | EPS past 5Y | -31.04% |
| P/S | 0.77 | EPS next 5Y | - |
| P/B | 0.34 | EPS Q/Q | 96.97% |
| Dividend | - | Sales Q/Q | 12.70% |
| Insider Own | 55.94% | Inst Own | 7.95% |
| Insider Trans | 1.77% | Inst Trans | -11.31% |
| Short Float | 0.56% | Earnings | - |
| Analyst Recom | - | Target Price | - |
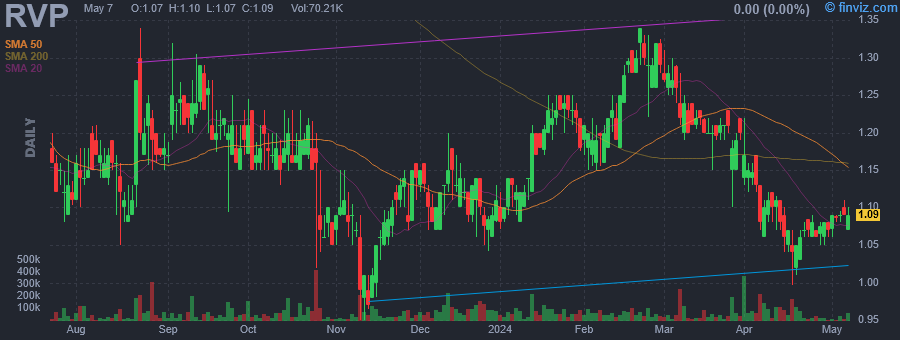
| Avg Volume | 70.26K | 52W Range | 0.95 - 1.42 |
|
|
|
|
Retractable Technologies, Inc. engages in the manufacture and market of safety needle devices for the healthcare industry. It offers injection devices, blood collection devices, and infusion devices. The company was founded by Thomas J. Shaw on May 9, 1994 and is headquartered in Little Elm, TX. |
| Insider Trading |
Relationship |
Date |
Transaction |
Cost |
#Shares |
Value ($) |
#Shares Total |
SEC Form 4 |
| SHAW THOMAS J | PRESIDENT AND CEO | May 13 '24 | Buy | 1.08 | 5,169 | 5,604 | 14,367,303 | May 14 12:21 PM | | SHAW THOMAS J | PRESIDENT AND CEO | May 10 '24 | Buy | 1.09 | 4,191 | 4,568 | 14,362,134 | May 14 12:21 PM | | SHAW THOMAS J | PRESIDENT AND CEO | May 06 '24 | Buy | 1.09 | 4,240 | 4,622 | 14,357,943 | May 07 10:12 AM | | SHAW THOMAS J | PRESIDENT AND CEO | Apr 26 '24 | Buy | 1.07 | 850 | 908 | 14,353,703 | Apr 29 03:16 PM | | SHAW THOMAS J | PRESIDENT AND CEO | Apr 25 '24 | Buy | 1.05 | 22 | 23 | 14,352,853 | Apr 29 03:16 PM |
|
|
| |
 |
| Market Cap | 29.19M | EPS (ttm) | -1.34 |
| P/E | - | EPS this Y | 58.78% |
| Forward P/E | - | EPS next Y | -34.43% |
| PEG | - | EPS past 5Y | - |
| P/S | 1.94 | EPS next 5Y | - |
| P/B | - | EPS Q/Q | -2.38% |
| Dividend | - | Sales Q/Q | - |
| Insider Own | 57.55% | Inst Own | 11.43% |
| Insider Trans | 0.08% | Inst Trans | 8.06% |
| Short Float | 3.14% | Earnings | May 07/a |
| Analyst Recom | 1.00 | Target Price | 5.87 |
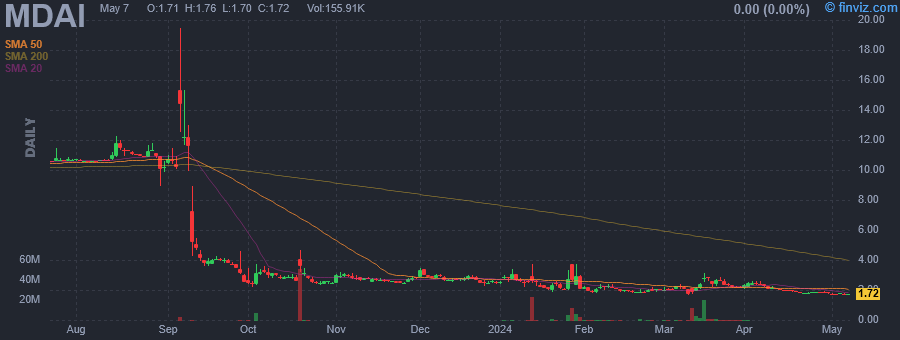
| Avg Volume | 1.20M | 52W Range | 1.61 - 19.50 |
|
|
|
|
Spectral AI, Inc. is a predictive artificial intelligence company. It focuses on medical diagnostics for faster and more accurate treatment decisions in wound care for burn, DFU, and future clinical applications. Its DeepView platform is a predictive diagnostic device that offers clinicians an objective and immediate assessment of a wound's healing potential prior to treatment or other medical intervention. The company was founded on November 17, 2020 and is headquartered in Dallas, TX. |
| Insider Trading |
Relationship |
Date |
Transaction |
Cost |
#Shares |
Value ($) |
#Shares Total |
SEC Form 4 |
| DiMaio John Michael | Director | May 10 '24 | Buy | 1.72 | 6,000 | 10,320 | 2,491,908 | May 14 11:17 AM | | DiMaio John Michael | 10% Owner | Nov 20 '23 | Buy | 2.67 | 2,000 | 5,340 | 2,481,908 | Nov 22 01:11 PM | | Radecki Brian J | Director | Sep 11 '23 | Option Exercise | 0.00 | 25,000 | 0 | 25,000 | Sep 13 12:48 PM | | Edmonds Franklin S. Jr. | Director | Sep 11 '23 | Option Exercise | 0.00 | 20,000 | 0 | 20,000 | Sep 13 12:46 PM | | Rosecliff Acquisition Sponsor | Director | Sep 11 '23 | Option Exercise | 0.00 | 815,000 | 0 | 815,000 | Sep 13 12:44 PM |
|
|
|
 |
| Market Cap | 786.33M | EPS (ttm) | 1.54 |
| P/E | 14.50 | EPS this Y | 8.69% |
| Forward P/E | 10.96 | EPS next Y | 21.62% |
| PEG | 8.68 | EPS past 5Y | 0.14% |
| P/S | 0.67 | EPS next 5Y | 1.67% |
| P/B | 1.51 | EPS Q/Q | -0.40% |
| Dividend | 4.22% | Sales Q/Q | -7.48% |
| Insider Own | 41.73% | Inst Own | 33.76% |
| Insider Trans | 0.28% | Inst Trans | -2.00% |
| Short Float | 0.50% | Earnings | May 01/b |
| Analyst Recom | 2.00 | Target Price | 25.33 |
| Avg Volume | 91.43K | 52W Range | 20.91 - 23.68 |
|
|
|
|
Westlake Chemical Partners LP engages in the operation, acquisition and development of ethylene production facilities and related assets. It is also involved in the manufacture and marketing of basic chemicals, polymers, and fabricated building products. The company was founded on March 14, 2014 and is headquartered in Houston, TX. |
| Insider Trading |
Relationship |
Date |
Transaction |
Cost |
#Shares |
Value ($) |
#Shares Total |
SEC Form 4 |
| Kenner Andrew | SVP, Olefin Material & Corp Pr | May 10 '24 | Buy | 22.07 | 7,178 | 158,440 | 168,017 | May 14 09:40 AM | | Kenner Andrew | SVP, Olefin Material & Corp Pr | May 08 '24 | Buy | 22.10 | 10,000 | 221,000 | 160,839 | May 10 07:29 AM | | Kenner Andrew | SVP, Olefin Material & Corp Pr | Mar 28 '24 | Buy | 22.23 | 5,000 | 111,150 | 150,839 | Apr 01 06:28 AM | | Kenner Andrew | SVP, Olefin Material & Corp Pr | Mar 21 '24 | Buy | 22.16 | 4,230 | 93,737 | 145,839 | Mar 25 10:17 AM | | Kenner Andrew | SVP, Olefin Material & Corp Pr | Mar 06 '24 | Buy | 22.30 | 5,000 | 111,500 | 141,609 | Mar 07 08:32 AM |
|
|
| |
 |
| Market Cap | 1.26B | EPS (ttm) | -0.93 |
| P/E | - | EPS this Y | -16.31% |
| Forward P/E | 21.12 | EPS next Y | 41.51% |
| PEG | - | EPS past 5Y | - |
| P/S | 0.60 | EPS next 5Y | 7.70% |
| P/B | 1.49 | EPS Q/Q | -33.81% |
| Dividend | - | Sales Q/Q | -3.53% |
| Insider Own | 1.94% | Inst Own | 108.52% |
| Insider Trans | 3.67% | Inst Trans | -1.63% |
| Short Float | 9.28% | Earnings | May 08/b |
| Analyst Recom | 2.36 | Target Price | 21.60 |
| Avg Volume | 1.14M | 52W Range | 13.71 - 27.02 |
|
|
|
|
National Vision Holdings, Inc. engages in the retail of optical products. It operates through the following segments: Owned and Host, Legacy, and Corporate and Other. The Owned and Host segment offers America's Best and Eyeglass World brands. The Legacy segment includes inventory and lab processing services. The Corporate and Other segment relates to the results of operations of the other operating segments and corporate overhead support. The company was founded in 1990 and is headquartered in Duluth, GA. |
| Insider Trading |
Relationship |
Date |
Transaction |
Cost |
#Shares |
Value ($) |
#Shares Total |
SEC Form 4 |
| FAHS L READE | Chief Executive Officer | May 13 '24 | Buy | 14.96 | 20,000 | 299,200 | 633,097 | May 14 08:01 AM | | PEELER D RANDOLPH | Director | May 10 '24 | Buy | 14.45 | 34,000 | 491,198 | 182,880 | May 14 08:00 AM | | Rasmussen Melissa | Chief Financial Officer | Mar 05 '24 | Option Exercise | 0.00 | 1,279 | 0 | 21,689 | Mar 07 04:16 PM | | Moore Patrick R. | Chief Operating Officer | Mar 05 '24 | Option Exercise | 0.00 | 5,111 | 0 | 64,708 | Mar 07 04:13 PM | | Brandman Jared | SVP, GC and Secretary | Mar 05 '24 | Option Exercise | 0.00 | 2,556 | 0 | 36,030 | Mar 07 04:15 PM |
|
|
|
 |
| Market Cap | 27.00M | EPS (ttm) | -0.20 |
| P/E | - | EPS this Y | -886.50% |
| Forward P/E | - | EPS next Y | - |
| PEG | - | EPS past 5Y | - |
| P/S | 15.88 | EPS next 5Y | - |
| P/B | - | EPS Q/Q | 91.90% |
| Dividend | - | Sales Q/Q | -62.50% |
| Insider Own | 74.42% | Inst Own | - |
| Insider Trans | 24.21% | Inst Trans | - |
| Short Float | 1.13% | Earnings | - |
| Analyst Recom | - | Target Price | - |
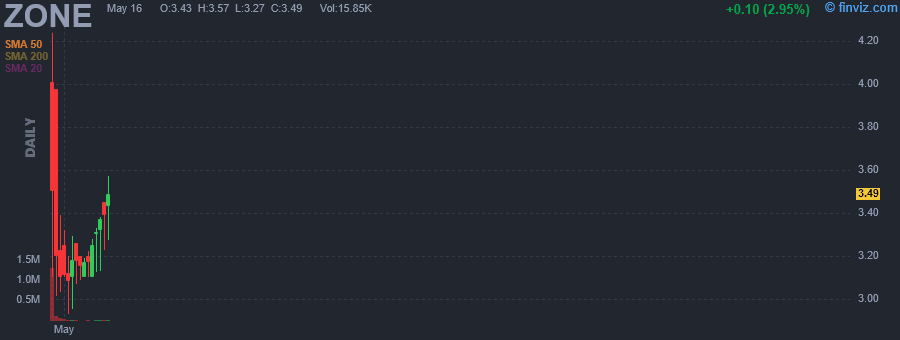
| Avg Volume | 132.54K | 52W Range | 2.93 - 4.24 |
|
|
|
|
CleanCore Solutions, Inc. engages in developing, manufacturing, and selling cleaning products that produces pure aqueous ozone for professional, industrial, and home use. The company's product includes fill station, power caddy, and power minicaddy, ice treatment machine, commercial laundry, and residential laundry. It offers products and solutions that are marketed for janitorial and sanitation, ice machine cleaning, laundry, and industrial industries. CleanCore Solutions, Inc. was formerly known as CC Acquisition Corp. and changed its name to CleanCore Solutions, Inc. in November 2022. The company was incorporated in 2022 and is based in Omaha, Nebraska. |
| Insider Trading |
Relationship |
Date |
Transaction |
Cost |
#Shares |
Value ($) |
#Shares Total |
SEC Form 4 |
| Cox Brent | Director | May 10 '24 | Buy | 0.26 | 880,000 | 224,928 | 880,000 | May 14 06:06 AM | | Ansari Mohammad Jawad | 10% Owner | Apr 30 '24 | Buy | 4.01 | 125,000 | 501,250 | 1,461,207 | May 08 04:09 PM | | Adams Clayton | 10% Owner | Apr 30 '24 | Buy | 3.10 | 5,000 | 15,500 | 470,000 | May 02 05:53 PM | | Adams Clayton | 10% Owner | Apr 26 '24 | Buy | 4.01 | 145,000 | 581,450 | 465,000 | Apr 26 04:05 PM |
|
|
|
 |
| Market Cap | 2.47B | EPS (ttm) | -0.09 |
| P/E | - | EPS this Y | -42.48% |
| Forward P/E | 33.17 | EPS next Y | 266.38% |
| PEG | - | EPS past 5Y | -49.92% |
| P/S | 0.64 | EPS next 5Y | - |
| P/B | 4.24 | EPS Q/Q | - |
| Dividend | - | Sales Q/Q | -9.60% |
| Insider Own | 2.02% | Inst Own | 99.28% |
| Insider Trans | 195.43% | Inst Trans | - |
| Short Float | 3.86% | Earnings | May 02/b |
| Analyst Recom | 2.94 | Target Price | 20.27 |
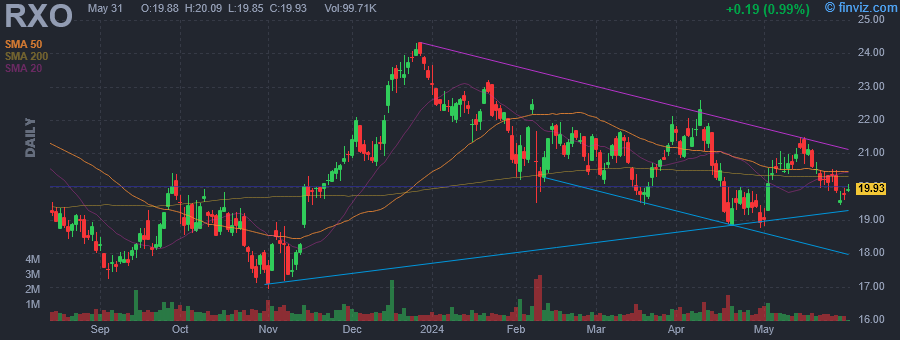
| Avg Volume | 599.75K | 52W Range | 16.94 - 24.33 |
|
|
| Today | Resumed |
Raymond James |
Mkt Perform |
|
|
|
|
RXO, Inc. engages in providing asset-light transportation solutions. It also offers managed transportation, freight forwarding, and last mile delivery. The company was founded on May 5, 2022 and is headquartered in Charlotte, NC. |
| Insider Trading |
Relationship |
Date |
Transaction |
Cost |
#Shares |
Value ($) |
#Shares Total |
SEC Form 4 |
| MFN Partners, LP | 10% Owner | May 09 '24 | Buy | 20.39 | 61 | 1,244 | 17,310,856 | May 13 07:51 PM | | MFN Partners, LP | 10% Owner | May 06 '24 | Buy | 20.40 | 361 | 7,364 | 17,310,795 | May 08 04:14 PM | | MFN Partners, LP | 10% Owner | May 03 '24 | Buy | 20.33 | 30,000 | 609,900 | 17,310,434 | May 06 04:34 PM | | Wilkerson Andrew M. | Chief Executive Officer | May 02 '24 | Option Exercise | 0.00 | 46,466 | 0 | 161,368 | May 06 04:46 PM | | MFN Partners, LP | 10% Owner | May 02 '24 | Buy | 20.07 | 105,065 | 2,108,655 | 17,280,434 | May 06 04:34 PM |
|
|
|
