 |
| Market Cap | 739.33M | EPS (ttm) | -0.57 |
| P/E | - | EPS this Y | 62.83% |
| Forward P/E | - | EPS next Y | 89.96% |
| PEG | - | EPS past 5Y | -19.48% |
| P/S | 4.79 | EPS next 5Y | - |
| P/B | - | EPS Q/Q | 68.44% |
| Dividend | - | Sales Q/Q | -6.40% |
| Insider Own | 36.87% | Inst Own | 27.85% |
| Insider Trans | -0.76% | Inst Trans | 2.90% |
| Short Float | 4.78% | Earnings | May 08/a |
| Analyst Recom | 2.43 | Target Price | 3.03 |
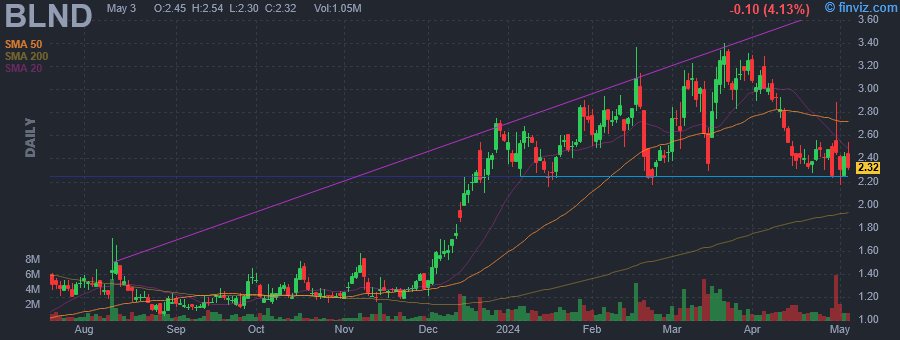
| Avg Volume | 1.91M | 52W Range | 0.80 - 3.40 |
|
|
|
|
Blend Labs, Inc. engages in the provision of a cloud-based software platform for financial services firms that is designed to power the end-to-end consumer journey for banking products. It operates through the Blend Platform and Title365 segments. The company was founded by Nima Ghamsari, Rosco Hill, Eugene Marinelli, and Erin James Collard on April 17, 2012 and is headquartered in San Francisco, CA. |
| Insider Trading |
Relationship |
Date |
Transaction |
Cost |
#Shares |
Value ($) |
#Shares Total |
SEC Form 4 |
| Jafari Amir | HEAD OF FINANCE AND ADMIN. | May 13 '24 | Buy | 2.97 | 5,808 | 17,223 | 408,524 | May 14 04:05 PM | | Ghamsari Nima | HEAD OF BLEND | Apr 24 '24 | Sale | 2.45 | 100,807 | 247,340 | 0 | Apr 26 04:05 PM | | Jafari Amir | HEAD OF FINANCE AND ADMIN. | Apr 12 '24 | Buy | 2.65 | 6,265 | 16,588 | 402,716 | Apr 15 04:05 PM | | Ghamsari Nima | HEAD OF BLEND | Mar 22 '24 | Sale | 2.99 | 81,700 | 244,291 | 34,774 | Mar 25 04:05 PM | | Jafari Amir | HEAD OF FINANCE AND ADMIN. | Mar 13 '24 | Buy | 3.00 | 5,555 | 16,665 | 396,451 | Mar 14 04:05 PM |
|
|
 |
 |
| Market Cap | 244.16M | EPS (ttm) | 0.21 |
| P/E | 82.11 | EPS this Y | - |
| Forward P/E | - | EPS next Y | - |
| PEG | - | EPS past 5Y | -16.49% |
| P/S | 2.74 | EPS next 5Y | - |
| P/B | 1.04 | EPS Q/Q | -33.40% |
| Dividend | 1.28% | Sales Q/Q | 15.39% |
| Insider Own | 13.55% | Inst Own | 39.08% |
| Insider Trans | 0.31% | Inst Trans | -15.26% |
| Short Float | 0.60% | Earnings | - |
| Analyst Recom | - | Target Price | - |
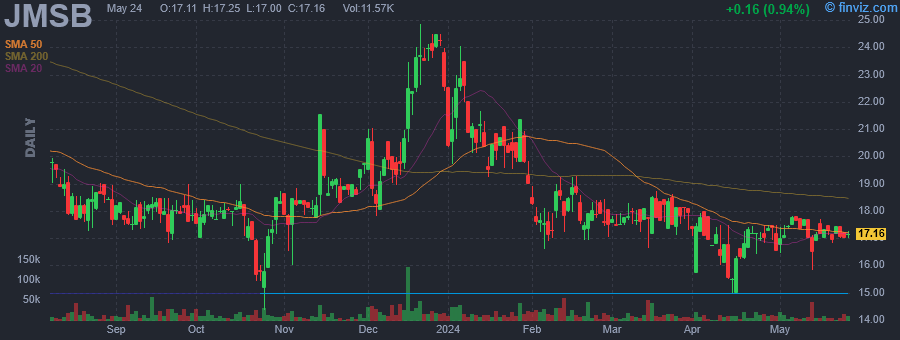
| Avg Volume | 14.10K | 52W Range | 14.38 - 24.84 |
|
|
|
May-13-24 09:00AM
|
John Marshall Bank Hires Ross A. Berman as Senior Vice President, Commercial Team Lead in Rockville
(Business Wire) |
|
Apr-25-24 09:56PM
|
JMSB Stock Earnings: John Marshall Bancorp Reported Results for Q1 2024
(InvestorPlace) |
|
09:05AM
|
John Marshall Bancorp, Inc. Announces Annual Cash Dividend
(Business Wire) |
|
09:00AM
|
John Marshall Bancorp, Inc. Reports First Quarter 2024 Results
(Business Wire) |
|
Apr-10-24 09:00AM
|
John Marshall Bank Hires Sean Biehl as Vice President, Commercial Lender in Northern Virginia
(Business Wire) |
|
Apr-08-24 09:00AM
|
John Marshall Bank Announces Escrow Optimizer, a New Digital Platform for Escrow Deposits
(Business Wire) |
|
Mar-04-24 09:00AM
|
John Marshall Bank Hires Lianne Wang as Senior Vice President, Regional Executive in Alexandria Market
(Business Wire) |
|
Feb-07-24 09:00AM
|
John Marshall Bank Hires Marie Brooks as Vice President, Branch Manager in the Loudoun Region
(Business Wire) |
|
Feb-06-24 09:00AM
|
John Marshall Bank Hires Brittany Wismer as VP, Business Development Officer Fiduciary Banking, to Support Growing Sales Efforts
(Business Wire) |
|
Jan-24-24 09:00AM
|
John Marshall Bancorp, Inc. Reports Higher Net Interest Margin, Strong Loan Growth and Pristine Asset Quality
(Business Wire) |
|
John Marshall Bancorp, Inc. operates as a bank holding company, which offers deposit and checking services, loans and lending solutions, cash management, and credit cards. The company was founded in May 2006 and is headquartered in Reston, VA. |
| Insider Trading |
Relationship |
Date |
Transaction |
Cost |
#Shares |
Value ($) |
#Shares Total |
SEC Form 4 |
| Kinney Jonathan Craig | Director | May 13 '24 | Buy | 16.69 | 800 | 13,353 | 175,698 | May 14 04:05 PM | | Kinney Jonathan Craig | Director | May 10 '24 | Buy | 17.20 | 300 | 5,160 | 108,698 | May 14 04:05 PM | | Kinney Jonathan Craig | Director | May 10 '24 | Buy | 17.55 | 181 | 3,177 | 174,898 | May 14 04:05 PM | | Kinney Jonathan Craig | Director | May 08 '24 | Buy | 17.50 | 100 | 1,750 | 174,717 | May 09 04:59 PM | | Kinney Jonathan Craig | Director | May 01 '24 | Buy | 16.50 | 260 | 4,290 | 108,398 | May 03 09:04 AM |
|
|
|
 |
| Market Cap | 75.88M | EPS (ttm) | -1.51 |
| P/E | - | EPS this Y | 25.84% |
| Forward P/E | 26.70 | EPS next Y | 130.30% |
| PEG | - | EPS past 5Y | - |
| P/S | 0.70 | EPS next 5Y | 20.00% |
| P/B | 0.94 | EPS Q/Q | -69.82% |
| Dividend | - | Sales Q/Q | -23.65% |
| Insider Own | 19.98% | Inst Own | 66.26% |
| Insider Trans | 4.41% | Inst Trans | -0.81% |
| Short Float | 0.55% | Earnings | May 08/a |
| Analyst Recom | 2.00 | Target Price | 6.00 |
| Avg Volume | 41.36K | 52W Range | 3.37 - 11.98 |
|
|
|
|
Amtech Systems, Inc. engages in the manufacture of semiconductors and capital equipment. It operates through the Semiconductor and Material and Substrate segments. The Semiconductor segment involves the designing, manufacturing, selling, and servicing of thermal processing equipment and related controls for use by semiconductor manufacturers, and in electronics, automotive, and other industries. The Material and Substrate segment produces consumables and machinery for lapping and polishing materials, such as sapphire substrates, optical components, silicon wafers, and numerous types of crystal materials, ceramics, and metal components. The company was founded by Jong S. Whang in October 1981 and is headquartered in Tempe, AZ. |
| Insider Trading |
Relationship |
Date |
Transaction |
Cost |
#Shares |
Value ($) |
#Shares Total |
SEC Form 4 |
| Averick Robert M | Director | May 14 '24 | Buy | 5.45 | 2,784 | 15,173 | 434,000 | May 14 04:02 PM | | Averick Robert M | Director | May 13 '24 | Buy | 5.16 | 304 | 1,569 | 431,216 | May 14 04:02 PM | | Averick Robert M | Director | May 10 '24 | Buy | 5.20 | 12,723 | 66,160 | 430,912 | May 14 04:02 PM | | Averick Robert M | Director | Mar 01 '24 | Option Exercise | 0.00 | 4,189 | 0 | 418,189 | Mar 04 04:01 PM | | LUDWIG MICHAEL M | Director | Mar 01 '24 | Option Exercise | 0.00 | 4,189 | 0 | 7,189 | Mar 04 05:17 PM |
|
|
| |
 |
| Market Cap | 364.25M | EPS (ttm) | 1.00 |
| P/E | 12.53 | EPS this Y | -10.12% |
| Forward P/E | 10.90 | EPS next Y | 54.16% |
| PEG | 2.24 | EPS past 5Y | -12.97% |
| P/S | 0.83 | EPS next 5Y | 5.60% |
| P/B | 0.54 | EPS Q/Q | -27.29% |
| Dividend | 7.02% | Sales Q/Q | 17.70% |
| Insider Own | 5.21% | Inst Own | 63.74% |
| Insider Trans | -2.66% | Inst Trans | -2.49% |
| Short Float | 2.90% | Earnings | Apr 24/b |
| Analyst Recom | 2.40 | Target Price | 14.25 |
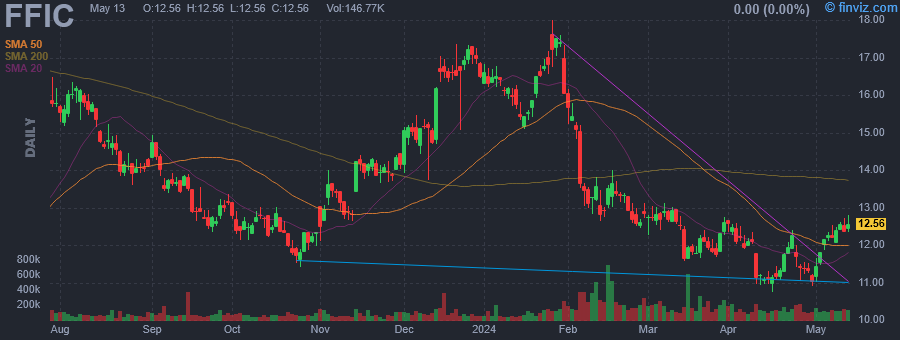
| Avg Volume | 193.29K | 52W Range | 9.45 - 18.00 |
|
|
|
|
Flushing Financial Corp. operates as a bank holding company, which provides banking and financial services. Its principal business is attracting retail deposits from the general public and investing those deposits together with funds generated from ongoing operations and borrowings, primarily in originations and purchases of multi-family residential properties, commercial business loans, commercial real estate mortgage loans, construction loans, small business administration loans and other small business loans, mortgage loans, U.S. government securities, corporate fixed-income securities and other marketable securities. The company was founded on May 9, 1994 and is headquartered in Uniondale, NY. |
| Insider Trading |
Relationship |
Date |
Transaction |
Cost |
#Shares |
Value ($) |
#Shares Total |
SEC Form 4 |
| Cullen Susan | SEVP/CFO | May 10 '24 | Buy | 12.46 | 600 | 7,476 | 73,407 | May 14 04:01 PM | | KORZEKWINSKI FRANCIS W | Sr. EVP | Feb 29 '24 | Sale | 13.04 | 4,851 | 63,257 | 68,642 | Mar 01 05:11 PM | | KORZEKWINSKI FRANCIS W | Sr. EVP | Feb 28 '24 | Sale | 12.61 | 7,649 | 96,454 | 73,493 | Mar 01 05:11 PM | | BUONAIUTO THOMAS | Sr. EVP | Feb 23 '24 | Sale | 13.21 | 19,000 | 250,990 | 32,391 | Feb 27 05:44 PM | | DIorio Steven J | Director | Dec 18 '23 | Sale | 16.42 | 6,500 | 106,730 | 47,000 | Dec 20 04:39 PM |
|
|
|
 |
| Market Cap | 2.32B | EPS (ttm) | -0.20 |
| P/E | - | EPS this Y | -22.60% |
| Forward P/E | 7.76 | EPS next Y | -12.20% |
| PEG | - | EPS past 5Y | 7.33% |
| P/S | 2.63 | EPS next 5Y | 5.00% |
| P/B | 0.63 | EPS Q/Q | - |
| Dividend | 12.88% | Sales Q/Q | -0.90% |
| Insider Own | 26.69% | Inst Own | 10.11% |
| Insider Trans | 0.81% | Inst Trans | - |
| Short Float | 7.74% | Earnings | May 08/a |
| Analyst Recom | 3.50 | Target Price | 5.50 |
| Avg Volume | 1.91M | 52W Range | 5.03 - 6.69 |
|
|
|
|
Prospect Capital Corporation is a business development company. It specializes in middle market, mature, mezzanine finance, later stage, emerging growth, leveraged buyouts, refinancing, acquisitions, recapitalizations, turnaround, growth capital, development, capital expenditures and subordinated debt tranches of collateralized loan obligations, cash flow term loans, market place lending and bridge transactions. It also makes real estate investments particularly in multi-family residential real estate asset class. The fund makes secured debt, senior debt, senior and secured term loans, unitranche debt, first-lien and second lien, private debt, private equity, mezzanine debt, and equity investments in private and microcap public businesses. It focuses on both primary origination and secondary loans/portfolios and invests in situations like debt financings for private equity sponsors, acquisitions, dividend recapitalizations, growth financings, bridge loans, cash flow term loans, real estate financings/investments. It also focuses on investing in small-sized and medium-sized private companies rather than large public companies. The fund typically invests across all industry sectors, with a particular expertise in the energy and industrial sectors. It invests in aerospace and defense, chemicals, conglomerate services, consumer services, ecological, electronics, financial services, machinery, manufacturing, media, pharmaceuticals, retail, software, specialty minerals, textiles and leather, transportation, oil and gas production, coal production, materials, industrials, consumer discretionary, information technology, utilities, pipeline, storage, power generation and distribution, renewable and clean energy, oilfield services, healthcare, food and beverage, education, business services, and other select sectors. It prefers to invest in the United States and Canada. The fund seeks to invest between $10 million to $500 million per transaction in companies with EBITDA between $5 million and $150 million, sales value between $25 million and $500 million, and enterprise value between $5 million and $1000 million. It fund also co-invests for larger deals. The fund seeks control acquisitions by providing multiple levels of the capital structure. The fund focuses on sole, agented, club, or syndicated deals. |
| Insider Trading |
Relationship |
Date |
Transaction |
Cost |
#Shares |
Value ($) |
#Shares Total |
SEC Form 4 |
| Barry John F | CHIEF EXECUTIVE OFFICER | May 10 '24 | Buy | 5.48 | 798,901 | 4,377,477 | 65,792,258 | May 14 04:01 PM | | Van Dask Kristin Lea | CFO, TREASURER, SECRETARY, CCO | Mar 11 '24 | Buy | 5.44 | 5,000 | 27,200 | 10,000 | Mar 13 04:03 PM | | Eliasek M Grier | Chief Operating Officer | Dec 06 '23 | Buy | 5.67 | 10,000 | 56,700 | 1,616,130 | Dec 08 04:01 PM | | Eliasek M Grier | Chief Operating Officer | Dec 05 '23 | Buy | 5.64 | 10,000 | 56,391 | 1,606,130 | Dec 07 05:04 PM | | Eliasek M Grier | Chief Operating Officer | Dec 04 '23 | Buy | 5.66 | 10,000 | 56,600 | 1,596,130 | Dec 06 04:01 PM |
|
|
| |
 |
| Market Cap | 22.79M | EPS (ttm) | -3.19 |
| P/E | - | EPS this Y | 64.73% |
| Forward P/E | - | EPS next Y | 73.97% |
| PEG | - | EPS past 5Y | -87.80% |
| P/S | 0.65 | EPS next 5Y | - |
| P/B | - | EPS Q/Q | 72.45% |
| Dividend | - | Sales Q/Q | -23.65% |
| Insider Own | 50.15% | Inst Own | 2.41% |
| Insider Trans | 110.49% | Inst Trans | -10.68% |
| Short Float | 1.46% | Earnings | May 09/a |
| Analyst Recom | 1.00 | Target Price | 6.00 |
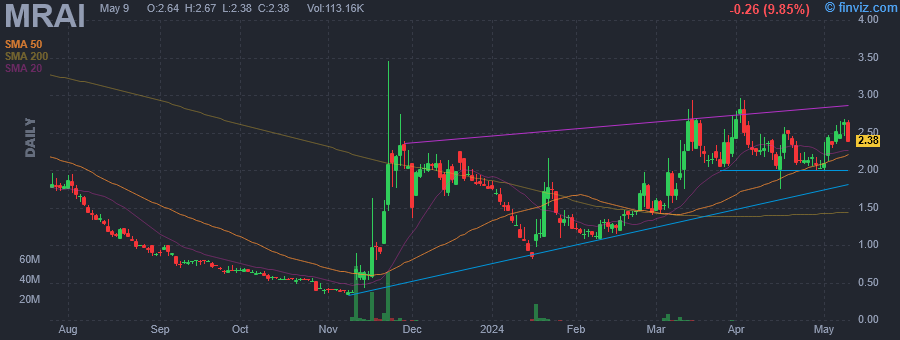
| Avg Volume | 420.04K | 52W Range | 0.33 - 3.46 |
|
|
|
|
Marpai, Inc. offers a SMART health plan services system that transforms health plan into a health empowerment tool. It provides health plan services system addresses the problems of healthcare. The firm uses deep learning, artificial intelligence, to empower people to live better, stay strong and spend less on healthcare. Its SMART health plan services enables companies to provide better healthcare to employees and significantly reduce administration, reinsurance and care costs. The company was founded in January 2021 and is headquartered in Tampa, FL. |
| Insider Trading |
Relationship |
Date |
Transaction |
Cost |
#Shares |
Value ($) |
#Shares Total |
SEC Form 4 |
| Lamendola Damien | Chief Executive Officer | May 10 '24 | Buy | 2.49 | 10,000 | 24,899 | 210,000 | May 14 04:01 PM | | EITAN YARON | Director | May 10 '24 | Buy | 2.66 | 5,000 | 13,300 | 606,454 | May 14 04:01 PM | | Dendy Michael Charles | Director | May 10 '24 | Sale | 2.32 | 42,752 | 99,065 | 61,098 | May 14 04:01 PM | | Dendy Michael Charles | Director | May 10 '24 | Sale | 2.40 | 2,371 | 5,701 | 17,629 | May 14 04:01 PM | | Lamendola Damien | Chief Executive Officer | Mar 07 '24 | Buy | 1.65 | 910,000 | 1,501,500 | 2,861,306 | Mar 08 04:01 PM |
|
|
|
 |
| Market Cap | 132.99M | EPS (ttm) | 0.56 |
| P/E | 24.48 | EPS this Y | - |
| Forward P/E | - | EPS next Y | - |
| PEG | - | EPS past 5Y | - |
| P/S | 2.14 | EPS next 5Y | - |
| P/B | 2.76 | EPS Q/Q | 363.61% |
| Dividend | 1.25% | Sales Q/Q | 3.29% |
| Insider Own | 30.45% | Inst Own | 28.79% |
| Insider Trans | 0.96% | Inst Trans | 1.01% |
| Short Float | 7.18% | Earnings | Feb 14/b |
| Analyst Recom | - | Target Price | - |
| Avg Volume | 179.18K | 52W Range | 4.91 - 29.92 |
|
|
|
|
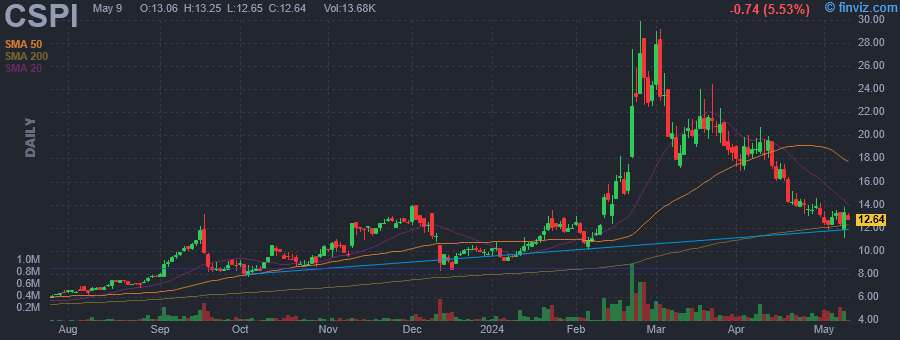
CSP, Inc. engages in the development and marketing of information technology integration solutions. It operates through the Technology Solutions (TS) and High-Performance Products (HPP) segments. The TS segment focuses on generating product revenues by reselling third-party computer hardware and software as a value-added reseller. The HPP segment involves the cybersecurity solution marketed as ARIA, Myricom network adapters and related software, and legacy Multicomputer product portfolio for digital signal processing. The company was founded in 1968 and is headquartered in Lowell, MA. |
| Insider Trading |
Relationship |
Date |
Transaction |
Cost |
#Shares |
Value ($) |
#Shares Total |
SEC Form 4 |
| NERGES JOSEPH R | Confidentiality agreement | May 14 '24 | Buy | 13.53 | 1,000 | 13,531 | 1,340,221 | May 14 03:57 PM | | NERGES JOSEPH R | Confidentiality agreement | May 13 '24 | Buy | 13.49 | 605 | 8,163 | 1,339,221 | May 14 03:57 PM | | NERGES JOSEPH R | Confidentiality agreement | May 10 '24 | Buy | 13.16 | 600 | 7,899 | 1,338,616 | May 14 03:57 PM | | NERGES JOSEPH R | Confidentiality agreement | Mar 15 '24 | Buy | 38.52 | 625 | 24,078 | 669,008 | Mar 18 03:08 PM | | NERGES JOSEPH R | Confidentiality agreement | Mar 14 '24 | Buy | 40.50 | 200 | 8,100 | 668,383 | Mar 18 03:08 PM |
|
|
| |
 |
| Market Cap | 200.07M | EPS (ttm) | 1.91 |
| P/E | 12.93 | EPS this Y | - |
| Forward P/E | - | EPS next Y | - |
| PEG | - | EPS past 5Y | -0.91% |
| P/S | 1.84 | EPS next 5Y | - |
| P/B | 1.11 | EPS Q/Q | -22.59% |
| Dividend | 4.78% | Sales Q/Q | 22.59% |
| Insider Own | 11.46% | Inst Own | 28.16% |
| Insider Trans | 0.23% | Inst Trans | 0.43% |
| Short Float | 0.74% | Earnings | - |
| Analyst Recom | - | Target Price | - |
| Avg Volume | 10.57K | 52W Range | 23.50 - 34.50 |
|
|
|
|
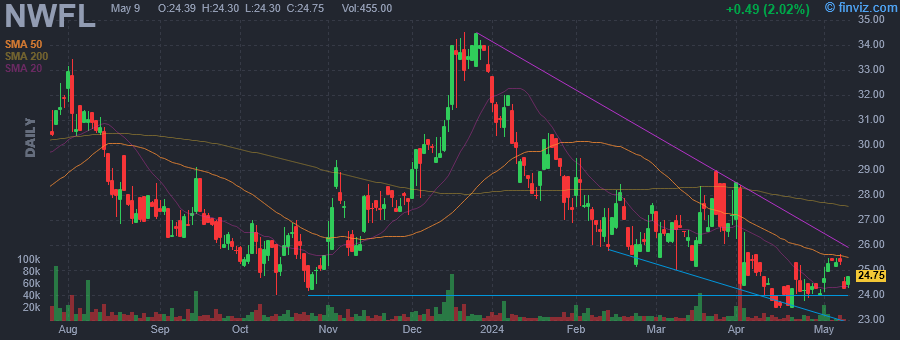
Norwood Financial Corp. is a bank holding company, which offers financial services and traditional banking to individual, business and government customers. It offers debit cards, savings accounts, personal loans, credit card, business lending, and wealth management. The company was founded in 1870 and is headquartered in Honesdale, PA. |
| Insider Trading |
Relationship |
Date |
Transaction |
Cost |
#Shares |
Value ($) |
#Shares Total |
SEC Form 4 |
| Gifford Jeffrey S | Director | May 10 '24 | Buy | 24.25 | 1,000 | 24,250 | 19,519 | May 14 03:38 PM | | FORTE ANDREW | Director | Apr 24 '24 | Buy | 24.63 | 400 | 9,852 | 7,544 | Apr 25 04:30 PM | | FORTE ANDREW | Director | Apr 24 '24 | Buy | 23.89 | 230 | 5,495 | 6,265 | Apr 24 05:43 PM | | Donnelly James O | President & CEO | Apr 23 '24 | Buy | 24.57 | 100 | 2,457 | 4,193 | Apr 24 12:57 PM | | Donnelly James O | President & CEO | Feb 22 '24 | Buy | 25.95 | 193 | 5,008 | 4,093 | Feb 23 01:47 PM |
|
|
|
 |
| Market Cap | 2.23B | EPS (ttm) | 2.61 |
| P/E | 27.75 | EPS this Y | 24.46% |
| Forward P/E | 13.19 | EPS next Y | 28.01% |
| PEG | 1.14 | EPS past 5Y | 7.64% |
| P/S | 1.77 | EPS next 5Y | 24.40% |
| P/B | 2.61 | EPS Q/Q | 980.96% |
| Dividend | 1.10% | Sales Q/Q | 5.68% |
| Insider Own | 0.81% | Inst Own | 120.57% |
| Insider Trans | 2.25% | Inst Trans | 2.16% |
| Short Float | 11.40% | Earnings | Apr 24/a |
| Analyst Recom | 1.88 | Target Price | 92.38 |
| Avg Volume | 527.68K | 52W Range | 61.05 - 138.47 |
|
|
|
|
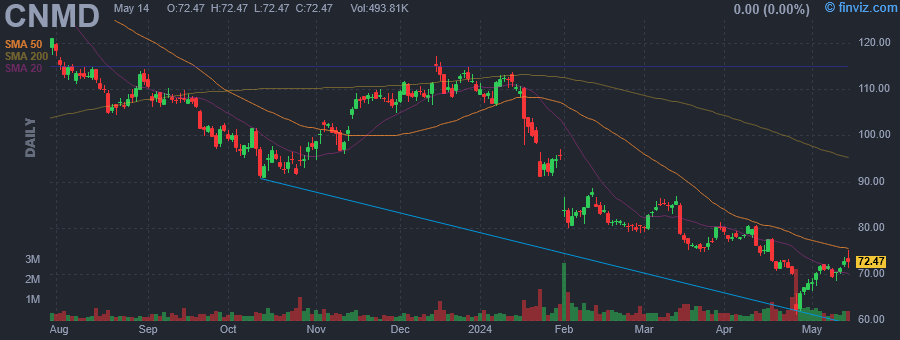
CONMED Corp. is a medical technology company, which engages in providing devices and equipment for surgical procedures. Its products include AirSeal and insufflation, allograft cartilage and tissue, arthroplasty, biliary and endoscopic ultrasound, biomedical sensors and electrodes, biopsy and polypectomy, dilators and accessories, electrosurgical units, fixation devices, hemostasis, implants and suture anchors, infection prevention, patient positioning, and related products. The company was founded by Eugene R. Corasanti in 1970 and is headquartered in Largo, FL. |
| Insider Trading |
Relationship |
Date |
Transaction |
Cost |
#Shares |
Value ($) |
#Shares Total |
SEC Form 4 |
| BRONSON DAVID M | Director | May 13 '24 | Buy | 72.09 | 1,350 | 97,322 | 16,460 | May 14 03:37 PM | | Schwarzentraub Barbara J | Director | May 08 '24 | Buy | 69.26 | 1,442 | 99,873 | 1,442 | May 10 05:29 PM | | Aronson Martha Goldberg | Director | May 06 '24 | Buy | 70.98 | 2,000 | 141,960 | 2,000 | May 08 04:20 PM | | Beyer Pat | Chief Operating Officer | Apr 30 '24 | Buy | 68.30 | 3,000 | 204,900 | 10,807 | May 02 01:03 PM | | Cohen Heather L | EVP & Chief HR & Legal Officer | Mar 08 '24 | Option Exercise | 68.91 | 52,500 | 3,617,900 | 59,612 | Mar 11 04:42 PM |
|
|
|
 |
| Market Cap | 136.71M | EPS (ttm) | 0.30 |
| P/E | 64.07 | EPS this Y | - |
| Forward P/E | - | EPS next Y | - |
| PEG | - | EPS past 5Y | -37.81% |
| P/S | 1.31 | EPS next 5Y | - |
| P/B | 0.32 | EPS Q/Q | 36.37% |
| Dividend | 3.48% | Sales Q/Q | 15.49% |
| Insider Own | 10.03% | Inst Own | 29.22% |
| Insider Trans | 10.04% | Inst Trans | -0.31% |
| Short Float | 2.83% | Earnings | Apr 24/a |
| Analyst Recom | - | Target Price | - |
| Avg Volume | 13.97K | 52W Range | 15.02 - 26.00 |
|
|
|
|
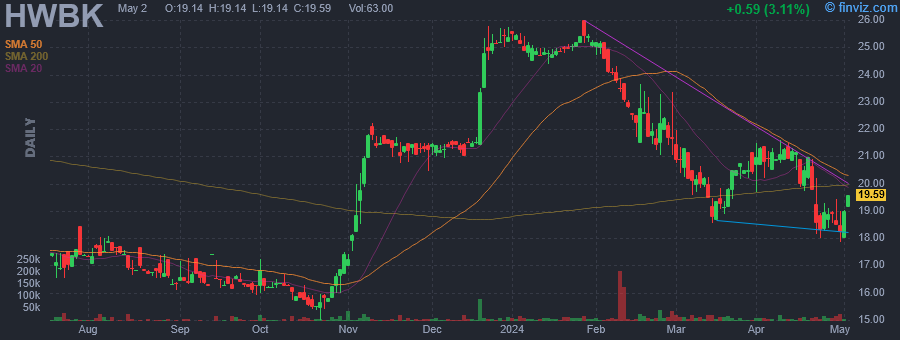
Hawthorn Bancshares, Inc. operates as a bank holding company, which provides banking services to individual and corporate customers through its subsidiary, Hawthorn Bank. It offers checking and savings accounts, internet banking, debit cards, certificates of deposit, brokerage services, personal loans, installment loans, trust services, credit related insurance, and safe deposit boxes. The company was founded in 1865 and is headquartered in Jefferson City, MO. |
| Insider Trading |
Relationship |
Date |
Transaction |
Cost |
#Shares |
Value ($) |
#Shares Total |
SEC Form 4 |
| Holtaway Jonathan | Director | May 10 '24 | Buy | 19.72 | 2,000 | 39,440 | 28,500 | May 14 03:21 PM | | Hettinger Shawna M. | Director | May 08 '24 | Buy | 19.64 | 1,000 | 19,645 | 4,103 | May 10 01:51 PM | | Eden Douglas Todd | Director | May 03 '24 | Buy | 19.63 | 15,000 | 294,390 | 76,826 | May 06 11:59 AM | | Holtaway Jonathan | Director | Apr 30 '24 | Buy | 18.76 | 5,500 | 103,180 | 26,500 | May 01 11:26 AM | | GILES BRENT M | CHIEF EXECUTIVE OFFICER | Apr 30 '24 | Buy | 18.18 | 400 | 7,274 | 7,968 | May 01 03:28 PM |
|
|
|
