 |
| Market Cap | 495.12M | EPS (ttm) | 1.30 |
| P/E | 10.92 | EPS this Y | -66.68% |
| Forward P/E | 14.38 | EPS next Y | 33.32% |
| PEG | 1.09 | EPS past 5Y | - |
| P/S | 0.28 | EPS next 5Y | 10.00% |
| P/B | 1.04 | EPS Q/Q | -90.34% |
| Dividend | - | Sales Q/Q | -39.11% |
| Insider Own | 5.38% | Inst Own | 104.17% |
| Insider Trans | -2.96% | Inst Trans | 0.90% |
| Short Float | 14.35% | Earnings | May 01/a |
| Analyst Recom | 2.44 | Target Price | 18.17 |
| Avg Volume | 395.99K | 52W Range | 14.30 - 28.75 |
|
|
|
|
Cross Country Healthcare, Inc. engages in the provision of healthcare staffing and workforce management solutions. It operates through the Nurse and Allied Staffing and Physician Staffing segments. The Nurse and Allied Staffing segment provides workforce solutions and traditional staffing, including temporary and permanent placement of travel nurses and allied professionals, branch-based local nurses, and allied staffing. The Physician Staffing segment includes certified registered nurse anesthetists, nurse practitioners, and physician assistants. The company was founded by Kevin C. Clark in 1986 and is headquartered in Boca Raton, FL. |
| Insider Trading |
Relationship |
Date |
Transaction |
Cost |
#Shares |
Value ($) |
#Shares Total |
SEC Form 4 |
| Mote Karen | Pres., Cross Country Locums | Mar 15 '24 | Sale | 16.95 | 6,216 | 105,361 | 35,101 | Mar 18 05:25 PM | | McDonald Colin Patrick | Chief Human Resources Officer | Feb 23 '24 | Sale | 17.11 | 4,000 | 68,460 | 17,568 | Feb 27 04:13 PM | | Grieco Cynthia Ann | VP, Corporate Treasurer | Nov 28 '23 | Sale | 20.70 | 1,000 | 20,700 | 6,464 | Nov 29 03:34 PM | | Ball Susan E | General Counsel and Secretary | Nov 22 '23 | Sale | 21.01 | 9,559 | 200,835 | 159,024 | Nov 22 05:05 PM | | Burns William J. | Chief Financial Officer | Nov 21 '23 | Sale | 21.39 | 15,000 | 320,850 | 217,698 | Nov 22 10:47 AM |
|
|
 |
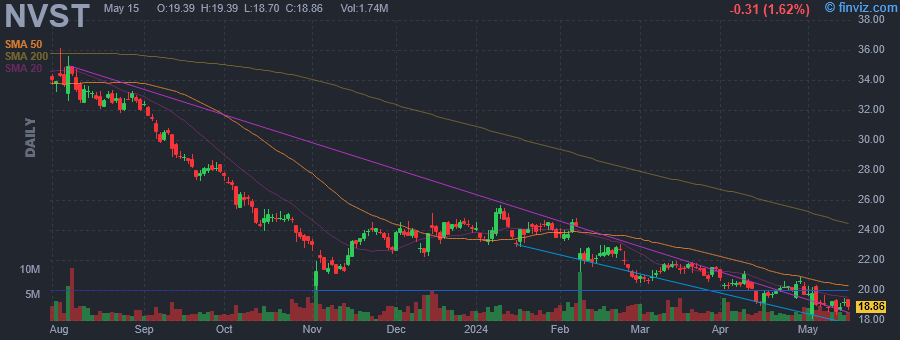 |
| Market Cap | 3.15B | EPS (ttm) | -0.71 |
| P/E | - | EPS this Y | -18.91% |
| Forward P/E | 12.97 | EPS next Y | 14.08% |
| PEG | - | EPS past 5Y | - |
| P/S | 1.23 | EPS next 5Y | 6.50% |
| P/B | 0.76 | EPS Q/Q | -44.88% |
| Dividend | - | Sales Q/Q | -0.57% |
| Insider Own | 0.49% | Inst Own | 106.29% |
| Insider Trans | 0.00% | Inst Trans | 0.03% |
| Short Float | 6.90% | Earnings | May 01/a |
| Analyst Recom | 2.67 | Target Price | 20.25 |
| Avg Volume | 2.14M | 52W Range | 18.09 - 36.14 |
|
|
|
|
Envista Holdings Corp. engages in the manufacturing and marketing of dental products, diagnostics, treatment, and trading. It operates through Specialty Products and Technologies, and Equipment and Consumables segments. The Specialty Products and Technologies segment develops, manufactures and markets dental implant systems, dental prosthetics and associated treatment software and technologies, as well as orthodontic bracket systems, aligners and lab products. The Equipment and Consumables segments develops, manufactures and markets dental equipment and supplies used in dental offices, including digital imaging systems, software and other visualization/magnification systems, handpieces and associated consumables, treatment units and other dental practice equipment, endodontic systems and related consumables, restorative materials and instruments, rotary burs, impression materials, bonding agents and cements and infection prevention products. It offers dental consumables, equipment, and services to dental professionals. The company was founded on August 29, 2018, and is headquartered in Brea, CA. |
| Insider Trading |
Relationship |
Date |
Transaction |
Cost |
#Shares |
Value ($) |
#Shares Total |
SEC Form 4 |
| Conley Eric | SVP, Orthodontics | Nov 16 '23 | Buy | 22.89 | 2,185 | 50,015 | 47,376 | Nov 20 05:49 PM | | Nance Mark E | General Counsel | Nov 08 '23 | Buy | 21.75 | 5,000 | 108,750 | 39,042 | Nov 09 04:18 PM | | Aghdaei Amir | Chief Executive Officer | Nov 06 '23 | Buy | 21.53 | 10,000 | 215,253 | 295,362 | Nov 07 04:23 PM | | Keller Stephen | Principal Financial Officer | Nov 06 '23 | Buy | 21.53 | 2,000 | 43,060 | 13,070 | Nov 07 04:18 PM |
|
|
|
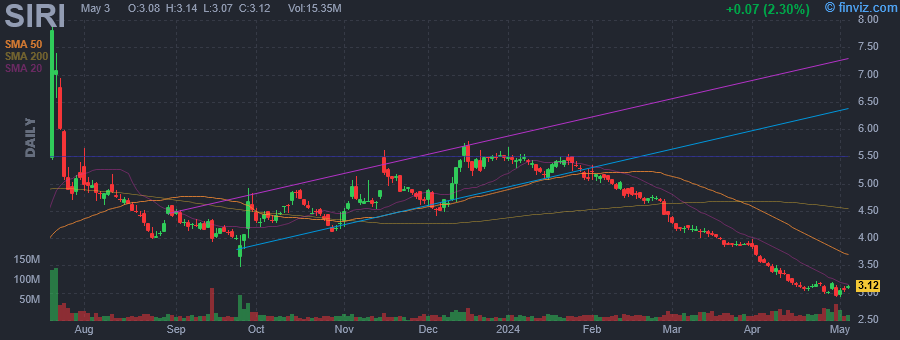 |
| Market Cap | 11.12B | EPS (ttm) | 0.33 |
| P/E | 8.66 | EPS this Y | -5.83% |
| Forward P/E | 9.01 | EPS next Y | 6.46% |
| PEG | 1.11 | EPS past 5Y | 4.66% |
| P/S | 1.24 | EPS next 5Y | 7.80% |
| P/B | - | EPS Q/Q | 15.49% |
| Dividend | 3.79% | Sales Q/Q | 0.84% |
| Insider Own | 83.65% | Inst Own | 9.93% |
| Insider Trans | -0.03% | Inst Trans | -5.05% |
| Short Float | 20.74% | Earnings | Apr 30/b |
| Analyst Recom | 2.43 | Target Price | 3.98 |
| Avg Volume | 17.53M | 52W Range | 2.92 - 7.95 |
|
|
|
|
Sirius XM Holdings, Inc. engages in the provision of audio entertainment. It operates through Sirius XM and Pandora and Off-Platform segments. The company was founded on May 17, 1990, and is headquartered in New York, NY. |
| Insider Trading |
Relationship |
Date |
Transaction |
Cost |
#Shares |
Value ($) |
#Shares Total |
SEC Form 4 |
| MAFFEI GREGORY B | Director | Apr 16 '24 | Option Exercise | 2.90 | 61,634 | 179,047 | 751,611 | Apr 17 04:20 PM | | MALONE EVAN DANIEL | Director | Mar 13 '24 | Option Exercise | 2.90 | 61,634 | 179,047 | 282,904 | Mar 14 04:08 PM | | Inzerillo Joseph A | Chief Product & Tech. Officer | Feb 13 '24 | Sale | 4.90 | 107,611 | 527,294 | 746,816 | Feb 14 04:07 PM | | MEYER JAMES E | Director | Feb 09 '24 | Sale | 4.92 | 800,000 | 3,935,920 | 1,091,472 | Feb 12 04:15 PM | | Witz Jennifer C | CEO | Aug 28 '23 | Buy | 4.11 | 250,000 | 1,026,900 | 2,812,000 | Aug 29 04:18 PM |
|
|
| |
 |
| Market Cap | - | EPS (ttm) | 0.42 |
| P/E | 49.77 | EPS this Y | - |
| Forward P/E | - | EPS next Y | - |
| PEG | - | EPS past 5Y | - |
| P/S | - | EPS next 5Y | - |
| P/B | 4.82 | EPS Q/Q | - |
| Dividend | - | Sales Q/Q | - |
| Insider Own | - | Inst Own | - |
| Insider Trans | - | Inst Trans | - |
| Short Float | - | Earnings | - |
| Analyst Recom | - | Target Price | - |
| Avg Volume | 422.02K | 52W Range | 19.80 - 30.00 |
|
|
Super Hi International Holding Ltd. is an investment holding company, which engages in the restaurant's operation, delivery business, sales of condiment products, and food ingredients located in overseas market outside Mainland China, Hong Kong, Macau, and Taiwan. It operates through the following geographical segments: Singapore, United States of America, Malaysia, Vietnam, and Others. The company was founded in 2012 and is headquartered in Singapore. |
|
|
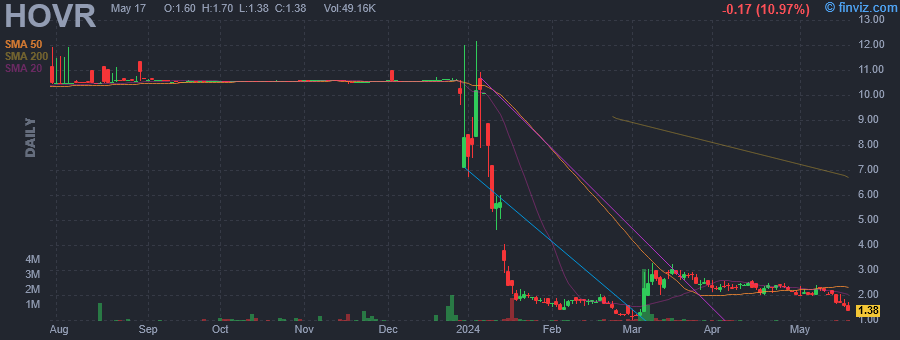 |
| Market Cap | 18.95M | EPS (ttm) | 0.56 |
| P/E | 1.85 | EPS this Y | - |
| Forward P/E | - | EPS next Y | - |
| PEG | - | EPS past 5Y | - |
| P/S | - | EPS next 5Y | - |
| P/B | - | EPS Q/Q | -609.09% |
| Dividend | - | Sales Q/Q | - |
| Insider Own | 55.45% | Inst Own | 12.58% |
| Insider Trans | 0.00% | Inst Trans | - |
| Short Float | 0.18% | Earnings | - |
| Analyst Recom | - | Target Price | - |
| Avg Volume | 129.32K | 52W Range | 1.00 - 12.14 |
|
|
|
|
New Horizon Aircraft Ltd. is an advanced aerospace original equipment manufacturer, which engages in the designing and aiming to build a next generation hybrid electric vertical takeoff and landing aircraft for the regional air mobility market. The company was founded on March 11, 2022 and is headquartered in Lindsay, Canada. |
|
| |
 |
| Market Cap | 279.09M | EPS (ttm) | -1.45 |
| P/E | - | EPS this Y | -33.40% |
| Forward P/E | - | EPS next Y | -13.39% |
| PEG | - | EPS past 5Y | -37.16% |
| P/S | 8.36 | EPS next 5Y | 14.50% |
| P/B | 0.81 | EPS Q/Q | -0.74% |
| Dividend | - | Sales Q/Q | -30.64% |
| Insider Own | 11.56% | Inst Own | 74.89% |
| Insider Trans | 0.00% | Inst Trans | 8.97% |
| Short Float | 13.32% | Earnings | May 07/a |
| Analyst Recom | 1.22 | Target Price | 19.75 |
| Avg Volume | 1.79M | 52W Range | 3.01 - 8.59 |
|
|
|
|
Caribou Biosciences, Inc. engages in the development of an internal pipeline of off-the-shelf CAR-T and CAR-NK cell therapies. Its tools and technologies provide transformative capabilities to basic and applied biological research, therapeutic development, agricultural biotechnology, and industrial biotechnology. The company was founded by Jennifer A. Doudna, Rachel E. Haurwitz, Martin Jinek and James Berger on October 28, 2011 and is headquartered in Berkeley, CA. |
| Insider Trading |
Relationship |
Date |
Transaction |
Cost |
#Shares |
Value ($) |
#Shares Total |
SEC Form 4 |
| Kanner Steven | Chief Scientific Officer | Feb 06 '24 | Option Exercise | 2.69 | 30,577 | 82,252 | 354,037 | Feb 08 05:06 PM | | Haurwitz Rachel E. | President and CEO | Jun 08 '23 | Option Exercise | 2.96 | 10,000 | 29,600 | 40,000 | Jun 09 04:31 PM |
|
|
|
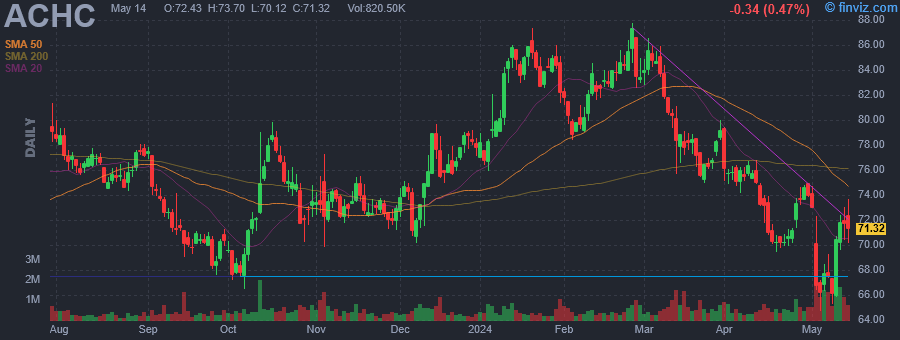 |
| Market Cap | 6.06B | EPS (ttm) | -0.14 |
| P/E | - | EPS this Y | 1.77% |
| Forward P/E | 16.55 | EPS next Y | 12.84% |
| PEG | - | EPS past 5Y | 34.75% |
| P/S | 2.03 | EPS next 5Y | 10.26% |
| P/B | 2.09 | EPS Q/Q | 14.94% |
| Dividend | - | Sales Q/Q | 9.06% |
| Insider Own | 2.90% | Inst Own | 100.89% |
| Insider Trans | -1.74% | Inst Trans | -8.00% |
| Short Float | 3.56% | Earnings | May 01/a |
| Analyst Recom | 1.54 | Target Price | 88.78 |
| Avg Volume | 767.52K | 52W Range | 64.74 - 87.77 |
|
|
|
|
Acadia Healthcare Co., Inc. engages in the provision of behavioral healthcare services across the United States. The firm provides services to its patients in a variety of settings, including inpatient psychiatric hospitals, specialty treatment facilities, residential treatment centers, and outpatient clinics. The company was founded in January 2005 and is headquartered in Franklin, TN. |
| Insider Trading |
Relationship |
Date |
Transaction |
Cost |
#Shares |
Value ($) |
#Shares Total |
SEC Form 4 |
| Miquelon Wade D | Director | Mar 05 '24 | Sale | 85.39 | 2,203 | 188,114 | 46,074 | Mar 06 05:30 PM | | Gregg Vicky B | Director | Mar 04 '24 | Sale | 85.56 | 2,500 | 213,900 | 26,851 | Mar 06 05:28 PM | | OSTEEN DEBRA K | Director | Dec 13 '23 | Sale | 77.67 | 35,000 | 2,718,450 | 675,833 | Dec 14 09:14 PM | | OSTEEN DEBRA K | Director | Dec 12 '23 | Sale | 76.23 | 8,000 | 609,840 | 710,833 | Dec 14 09:14 PM | | Hollinsworth John S. | EVP of Operations | Nov 14 '23 | Sale | 74.01 | 92,500 | 6,846,300 | 84,630 | Nov 16 05:01 PM |
|
|
| |
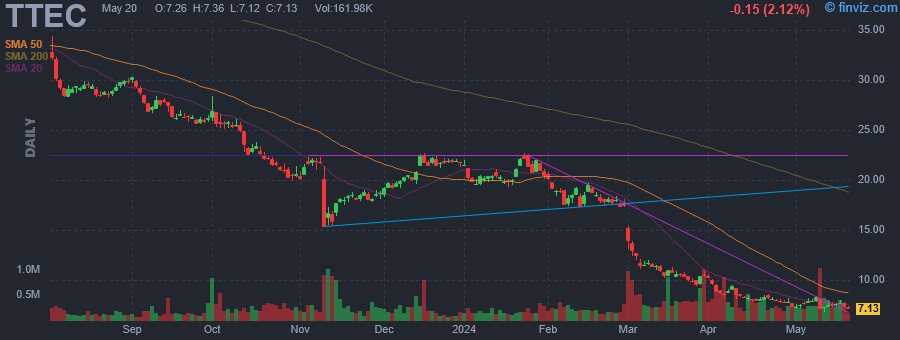 |
| Market Cap | 328.16M | EPS (ttm) | -0.26 |
| P/E | - | EPS this Y | -36.57% |
| Forward P/E | 3.95 | EPS next Y | 26.31% |
| PEG | - | EPS past 5Y | -25.46% |
| P/S | 0.14 | EPS next 5Y | 6.00% |
| P/B | 0.55 | EPS Q/Q | -112.35% |
| Dividend | 8.29% | Sales Q/Q | -9.13% |
| Insider Own | 59.19% | Inst Own | 39.52% |
| Insider Trans | 0.00% | Inst Trans | -1.95% |
| Short Float | 17.30% | Earnings | May 08/a |
| Analyst Recom | 2.43 | Target Price | 11.00 |
| Avg Volume | 397.44K | 52W Range | 6.84 - 36.27 |
|
|
|
|
TTEC Holdings, Inc. is a digital global customer experience technology and services company. It focuses on the design, implementation, and delivery of transformative solutions for many brands. The firm operates through the following segments: TTEC Digital and TTEC Engage. The TTEC Digital segment provides design, build, and operate tech-enabled, insight-driven CX solutions. The TTEC Engage segment provides digitally-enabled customer care, acquisition, and fraud prevention services. The company was founded by Kenneth D. Tuchman in 1982 and is headquartered in Greenwood Village, CO. |
| Insider Trading |
Relationship |
Date |
Transaction |
Cost |
#Shares |
Value ($) |
#Shares Total |
SEC Form 4 |
| Swanback Michelle R | PRESIDENT, CEO, TTEC ENGAGE | May 02 '24 | Option Exercise | 0.00 | 12,190 | 0 | 28,703 | May 06 04:37 PM | | Bourret Francois | CHIEF ACCOUNTING OFFICER | Apr 14 '24 | Option Exercise | 0.00 | 1,191 | 0 | 6,004 | Apr 16 04:44 PM | | McLean Margaret B | GC & CRO | Apr 14 '24 | Option Exercise | 0.00 | 1,634 | 0 | 54,757 | Apr 16 04:51 PM | | Bourret Francois | CHIEF ACCOUNTING OFFICER | Mar 17 '24 | Option Exercise | 0.00 | 2,718 | 0 | 5,832 | Mar 19 04:35 PM | | Swanback Michelle R | PRESIDENT, CEO, TTEC ENGAGE | Mar 16 '24 | Option Exercise | 0.00 | 10,986 | 0 | 19,672 | Mar 19 04:31 PM |
|
|
|
 |
| Market Cap | 2.40B | EPS (ttm) | -1.24 |
| P/E | - | EPS this Y | 4.59% |
| Forward P/E | 1.55 | EPS next Y | 16.09% |
| PEG | - | EPS past 5Y | 32.76% |
| P/S | 0.27 | EPS next 5Y | 2.60% |
| P/B | - | EPS Q/Q | 68.46% |
| Dividend | - | Sales Q/Q | 10.75% |
| Insider Own | 2.41% | Inst Own | 78.04% |
| Insider Trans | -0.07% | Inst Trans | 18.33% |
| Short Float | 5.73% | Earnings | May 02/b |
| Analyst Recom | 2.88 | Target Price | 9.83 |
| Avg Volume | 3.32M | 52W Range | 6.49 - 11.46 |
|
|
|
|
Bausch Health Cos., Inc. engages in the development, manufacture and market of a range of branded, generic and branded generic pharmaceuticals, medical devices and over-the-counter products. It operates through the following segments: Salix, International, Solta Medical, Diversified Products, and Bausch + Lomb. The Salix segment consists of sales in the U.S. of GI products. Sales of the Xifaxan product line. The International segment comprises of sales, except for sales of Bausch + Lomb products and Solta aesthetic medical devices, outside the U.S and Puerto Rico of branded pharmaceutical products, branded generic pharmaceutical and OTC products. The Solta Medical segment refers to global sales of Solta Medical aesthetic medical devices. The Diversified Products segment covers sales in the U.S. of pharmaceutical products in the areas of neurology and certain other therapeutic classes, generic products, ortho dermatologic, and dentistry products. The Bausch + Lomb segment are global sales of Bausch + Lomb vision care, surgical and ophthalmic pharmaceuticals products. The company was founded on March 29, 1994, and is headquartered in Laval, Canada. |
| Insider Trading |
Relationship |
Date |
Transaction |
Cost |
#Shares |
Value ($) |
#Shares Total |
SEC Form 4 |
| Carson Seana | EVP, General Counsel | Mar 04 '24 | Sale | 9.80 | 6,313 | 61,867 | 499,905 | Mar 04 04:16 PM | | Carson Seana | EVP, General Counsel | Dec 05 '23 | Sale | 7.38 | 220 | 1,624 | 382,925 | Dec 05 04:35 PM | | Carson Seana | EVP, General Counsel | Nov 06 '23 | Sale | 7.61 | 43 | 327 | 384,836 | Nov 06 05:06 PM | | Carson Seana | EVP, General Counsel | Sep 06 '23 | Sale | 8.28 | 6,685 | 55,352 | 385,213 | Sep 06 04:33 PM |
|
|
|
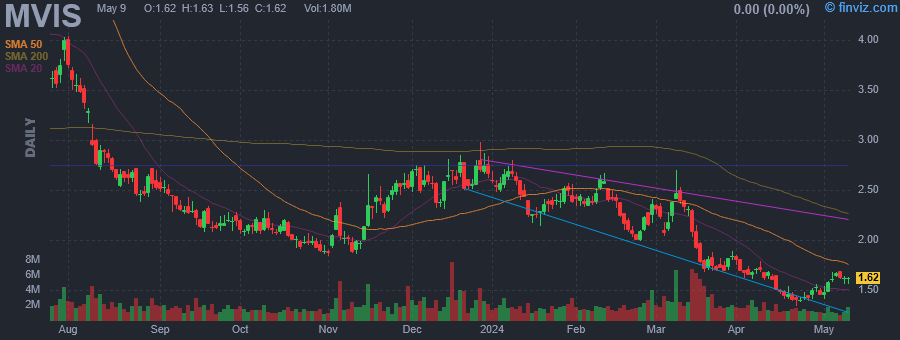 |
| Market Cap | 231.46M | EPS (ttm) | -0.48 |
| P/E | - | EPS this Y | -13.33% |
| Forward P/E | - | EPS next Y | 6.86% |
| PEG | - | EPS past 5Y | -13.75% |
| P/S | 31.15 | EPS next 5Y | 10.00% |
| P/B | 2.46 | EPS Q/Q | -22.77% |
| Dividend | - | Sales Q/Q | 22.25% |
| Insider Own | 0.99% | Inst Own | 31.07% |
| Insider Trans | 0.00% | Inst Trans | -2.46% |
| Short Float | 25.48% | Earnings | May 09/a |
| Analyst Recom | 3.00 | Target Price | 2.31 |
| Avg Volume | 2.65M | 52W Range | 1.12 - 8.20 |
|
|
|
|
MicroVision, Inc. engages in the development of laser beam scanning technology. The company integrates micro-electrical mechanical systems (MEMS), lasers, optics, hardware, algorithms and machine learning software into its proprietary technology to address existing and emerging markets. It also develops automotive lidar sensors and provide solutions for advanced driver-assistance systems (ADAS), autonomous vehicles, and non-automotive applications. The company was founded in May 1993 and is headquartered in Redmond, WA. |
| Insider Trading |
Relationship |
Date |
Transaction |
Cost |
#Shares |
Value ($) |
#Shares Total |
SEC Form 4 |
| Carlile Robert Paul | Director | May 17 '24 | Option Exercise | 0.00 | 11,439 | 0 | 204,328 | May 17 06:00 PM | | Spitzer Mark Bradley | Director | May 17 '24 | Option Exercise | 0.00 | 11,439 | 0 | 87,539 | May 17 06:00 PM | | Curran Judith Mecham | Director | May 17 '24 | Option Exercise | 0.00 | 11,439 | 0 | 82,463 | May 17 05:59 PM | | TURNER BRIAN V | Director | May 17 '24 | Option Exercise | 0.00 | 11,439 | 0 | 348,291 | May 17 05:59 PM | | Herbst Jeffrey A | Director | May 17 '24 | Option Exercise | 0.00 | 11,439 | 0 | 84,256 | May 17 05:59 PM |
|
|
|
