 |
| Market Cap | 3.46B | EPS (ttm) | 4.80 |
| P/E | 23.67 | EPS this Y | -0.69% |
| Forward P/E | 19.58 | EPS next Y | 21.76% |
| PEG | 8.77 | EPS past 5Y | 28.81% |
| P/S | 2.07 | EPS next 5Y | 2.70% |
| P/B | 3.66 | EPS Q/Q | -37.36% |
| Dividend | - | Sales Q/Q | -8.74% |
| Insider Own | 1.11% | Inst Own | 128.38% |
| Insider Trans | -10.34% | Inst Trans | 2.49% |
| Short Float | 12.68% | Earnings | May 14/a |
| Analyst Recom | 1.29 | Target Price | 118.67 |
| Avg Volume | 751.43K | 52W Range | 64.41 - 115.97 |
|
|
|
|
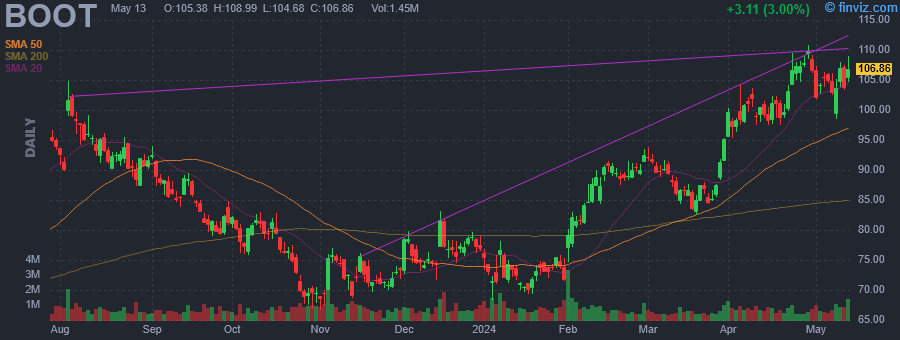
Boot Barn Holdings, Inc. engages in the operation of retail stores of western and work-related footwear, apparel, and accessories. The firm's products include boots, jeans, accessories, hats, gifts and home products, and work wear. Its brands include Ariat, Wrangler, Lucchese Boots, Idyllwind, and Cinch. The company was founded by Kenneth Meany in 1978 and is headquartered in Irvine, CA. |
| Insider Trading |
Relationship |
Date |
Transaction |
Cost |
#Shares |
Value ($) |
#Shares Total |
SEC Form 4 |
| Hazen John | CHIEF DIGITAL OFFICER | May 17 '24 | Sale | 113.21 | 3,563 | 403,367 | 1,309 | May 20 09:00 PM | | Conroy James Grant | PRESIDENT AND CEO | Feb 29 '24 | Option Exercise | 20.94 | 19,478 | 407,869 | 65,751 | Feb 29 05:41 PM | | Conroy James Grant | PRESIDENT AND CEO | Feb 29 '24 | Sale | 92.38 | 19,478 | 1,799,378 | 46,273 | Feb 29 05:41 PM | | Love Michael A | CHIEF RETAIL OFFICER | Feb 21 '24 | Option Exercise | 13.96 | 9,031 | 126,088 | 11,996 | Feb 22 04:37 PM | | Love Michael A | CHIEF RETAIL OFFICER | Feb 21 '24 | Sale | 88.64 | 9,031 | 800,508 | 2,965 | Feb 22 04:37 PM |
|
|
 |
 |
| Market Cap | 2.21B | EPS (ttm) | -0.63 |
| P/E | - | EPS this Y | 52.57% |
| Forward P/E | 67.97 | EPS next Y | 119.36% |
| PEG | - | EPS past 5Y | -3.93% |
| P/S | 0.44 | EPS next 5Y | - |
| P/B | 6.42 | EPS Q/Q | 18.85% |
| Dividend | - | Sales Q/Q | 10.12% |
| Insider Own | 24.65% | Inst Own | 43.79% |
| Insider Trans | -24.82% | Inst Trans | 0.44% |
| Short Float | 6.85% | Earnings | May 08/a |
| Analyst Recom | 2.33 | Target Price | 4.15 |
| Avg Volume | 4.97M | 52W Range | 1.82 - 4.68 |
|
|
|
|
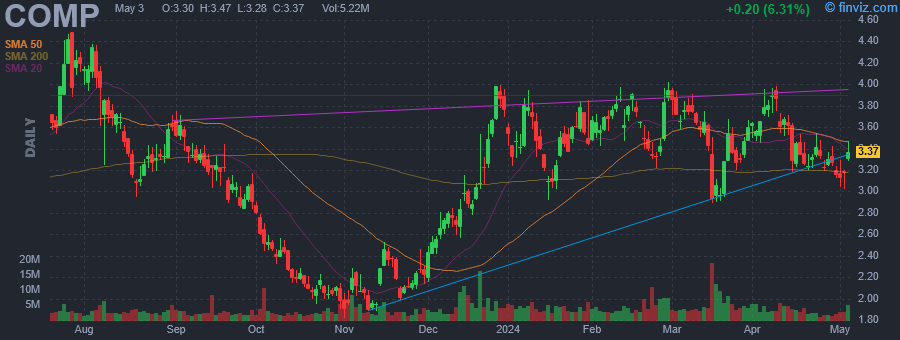
Compass, Inc. engages in the provision of an online real estate platform. Its platform provides an integrated suite of software for customer relationship management, marketing, client service, operations and other critical functionality, as well as brokerage services and adjacent services. The company was founded by Ori Allon and Robert Reffkin in 2012 and is headquartered in New York, NY. |
| Insider Trading |
Relationship |
Date |
Transaction |
Cost |
#Shares |
Value ($) |
#Shares Total |
SEC Form 4 |
| SVF Excalibur (Cayman) Ltd | 10% Owner | May 16 '24 | Sale | 4.30 | 16,900,000 | 72,670,000 | 75,570,273 | May 20 09:00 PM | | Wahlers Scott R. | Chief Accounting Officer | May 03 '24 | Option Exercise | 0.00 | 2,700 | 0 | 440,235 | May 07 04:36 PM | | Serwin Bradley K | General Counsel and Secretary | Apr 02 '24 | Option Exercise | 0.00 | 79,400 | 0 | 360,131 | Apr 04 04:21 PM | | PHILLIPS JR CHARLES E | Director | Apr 02 '24 | Option Exercise | 0.00 | 8,108 | 0 | 77,190 | Apr 04 04:21 PM | | McCarter Josh N. | Director | Apr 02 '24 | Option Exercise | 0.00 | 3,716 | 0 | 62,387 | Apr 04 04:21 PM |
|
|
|
 |
| Market Cap | 269.70M | EPS (ttm) | -1.12 |
| P/E | - | EPS this Y | 9.12% |
| Forward P/E | - | EPS next Y | 20.28% |
| PEG | - | EPS past 5Y | -30.17% |
| P/S | 3.31 | EPS next 5Y | - |
| P/B | 2.46 | EPS Q/Q | 6.78% |
| Dividend | - | Sales Q/Q | 2.34% |
| Insider Own | 45.08% | Inst Own | 32.07% |
| Insider Trans | -8.46% | Inst Trans | -3.38% |
| Short Float | 5.04% | Earnings | May 02/a |
| Analyst Recom | 2.67 | Target Price | 6.10 |
| Avg Volume | 161.37K | 52W Range | 1.04 - 9.75 |
|
|
|
|
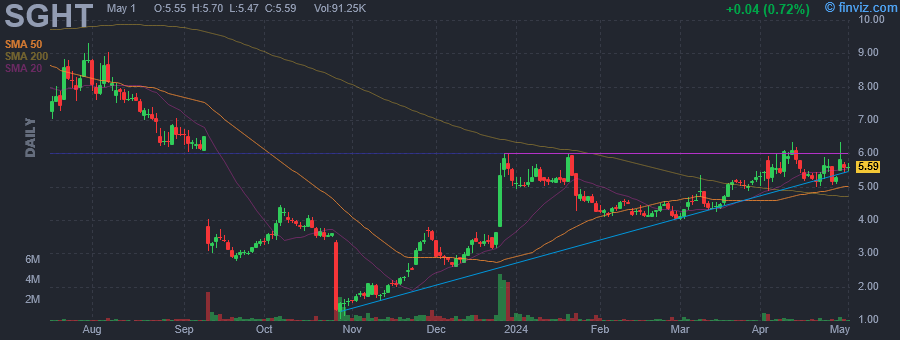
Sight Sciences, Inc. is an ophthalmic medical device company, which focuses on the development and commercialization of surgical and nonsurgical technologies for the treatment of prevalent eye diseases. It operates through the Surgical Glaucoma and Dry Eye segments. The Surgical Glaucoma segment includes OMNI Surgical System for use in minimally invasive glaucoma procedures. The Dry Eye segment offers TearCare System and related components. The company was founded by Paul Badawi and David Y. Badawi in 2011 and is headquartered in Menlo Park, CA. |
| Insider Trading |
Relationship |
Date |
Transaction |
Cost |
#Shares |
Value ($) |
#Shares Total |
SEC Form 4 |
| Bauerlein Alison | Chief Financial Officer | May 17 '24 | Sale | 5.42 | 13,066 | 70,870 | 413,182 | May 20 08:56 PM | | Badawi Paul | President and CEO | Apr 03 '24 | Sale | 5.08 | 12,571 | 63,848 | 5,750,729 | Apr 04 07:25 PM | | Bauerlein Alison | Chief Financial Officer | Apr 03 '24 | Sale | 5.08 | 10,123 | 51,415 | 426,248 | Apr 04 07:19 PM | | HAYDEN JEREMY B. | Chief Legal Officer | Apr 03 '24 | Sale | 5.08 | 4,893 | 24,852 | 168,620 | Apr 04 07:26 PM | | Park Sam Boong | Chief Operating Officer | Apr 03 '24 | Sale | 5.08 | 3,414 | 17,340 | 261,754 | Apr 04 07:24 PM |
|
|
| |
 |
| Market Cap | 56.25B | EPS (ttm) | 4.94 |
| P/E | 52.14 | EPS this Y | 15.70% |
| Forward P/E | 22.67 | EPS next Y | 12.05% |
| PEG | 4.92 | EPS past 5Y | 5.38% |
| P/S | 5.37 | EPS next 5Y | 10.60% |
| P/B | 4.98 | EPS Q/Q | 22.24% |
| Dividend | 0.93% | Sales Q/Q | 20.41% |
| Insider Own | 1.25% | Inst Own | 86.65% |
| Insider Trans | -4.69% | Inst Trans | 1.87% |
| Short Float | 0.83% | Earnings | Apr 25/a |
| Analyst Recom | 2.05 | Target Price | 263.47 |
| Avg Volume | 797.67K | 52W Range | 198.52 - 258.57 |
|
|
|
|
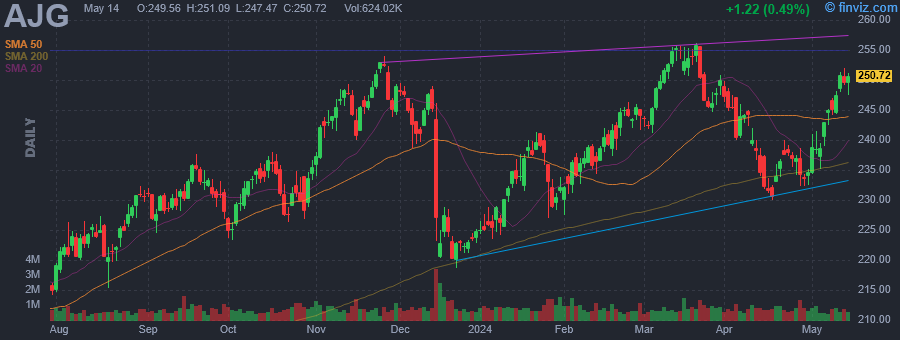
Arthur J. Gallagher & Co. engages in the provision of insurance brokerage, reinsurance brokerage, consulting, and third-party claims settlement and administration services. It operates through the following business segments: Brokerage, Risk Management, and Corporate. The Brokerage segment consists of retail and wholesale insurance brokerage operations. The Risk Management segment provides contract claim settlement and administration services. The Corporate segment manages clean energy and other investments. The company was founded by Arthur J. Gallagher in 1927 and is headquartered in Rolling Meadows, IL. |
| Insider Trading |
Relationship |
Date |
Transaction |
Cost |
#Shares |
Value ($) |
#Shares Total |
SEC Form 4 |
| Bay Walter D. | General Counsel | May 20 '24 | Option Exercise | 70.74 | 800 | 56,592 | 45,491 | May 20 08:42 PM | | Bay Walter D. | General Counsel | May 20 '24 | Sale | 257.24 | 800 | 205,792 | 44,691 | May 20 08:42 PM | | Bay Walter D. | General Counsel | May 17 '24 | Option Exercise | 70.74 | 8,717 | 616,641 | 53,408 | May 20 08:42 PM | | Bay Walter D. | General Counsel | May 17 '24 | Sale | 257.00 | 8,717 | 2,240,246 | 44,691 | May 20 08:42 PM | | Bay Walter D. | General Counsel | May 16 '24 | Option Exercise | 70.74 | 7,283 | 515,199 | 59,550 | May 20 08:42 PM |
|
|
|
 |
| Market Cap | 632.21M | EPS (ttm) | -1.02 |
| P/E | - | EPS this Y | -37.78% |
| Forward P/E | - | EPS next Y | 47.58% |
| PEG | - | EPS past 5Y | - |
| P/S | 3.16 | EPS next 5Y | - |
| P/B | 2.59 | EPS Q/Q | -72.32% |
| Dividend | - | Sales Q/Q | -17.68% |
| Insider Own | 5.53% | Inst Own | 85.28% |
| Insider Trans | -5.89% | Inst Trans | -0.52% |
| Short Float | 3.17% | Earnings | May 02/a |
| Analyst Recom | 1.67 | Target Price | 15.80 |
| Avg Volume | 188.53K | 52W Range | 8.13 - 15.91 |
|
|
|
|
nLIGHT, Inc. develops and manufactures semiconductor and fiber lasers components. Its products include semiconductor lasers, fiber lasers and optical fibers. It operates through the following segments: Laser Products and Advanced Development. The Laser Products segment includes products such as fiber lasers, diodes, complete laser systems and components. The Advanced Development segment includes the operating results of Nutronics since the date of acquisition. The company was founded by Scott H. Keeney, Mark DeVito and Jason Farmer in 2000 and is headquartered in Camas, WA. |
| Insider Trading |
Relationship |
Date |
Transaction |
Cost |
#Shares |
Value ($) |
#Shares Total |
SEC Form 4 |
| MOORE GEOFFREY | Director | May 16 '24 | Option Exercise | 0.91 | 77,590 | 70,442 | 109,982 | May 20 08:49 PM | | MOORE GEOFFREY | Director | May 16 '24 | Sale | 13.14 | 38,796 | 509,795 | 71,186 | May 20 08:49 PM | | Corso Joseph John | Chief Financial Officer | Mar 18 '24 | Sale | 12.26 | 14,105 | 172,927 | 146,601 | Mar 20 04:55 PM | | Keeney Scott H | President and CEO | Dec 15 '23 | Option Exercise | 0.75 | 84,516 | 63,387 | 1,340,030 | Dec 19 04:16 PM | | Keeney Scott H | President and CEO | Dec 15 '23 | Sale | 14.05 | 84,516 | 1,187,450 | 1,255,514 | Dec 19 04:16 PM |
|
|
| |
 |
| Market Cap | 1.30B | EPS (ttm) | -2.73 |
| P/E | - | EPS this Y | -11.53% |
| Forward P/E | - | EPS next Y | -16.67% |
| PEG | - | EPS past 5Y | -46.35% |
| P/S | 59.11 | EPS next 5Y | - |
| P/B | 2.14 | EPS Q/Q | 21.97% |
| Dividend | - | Sales Q/Q | -97.75% |
| Insider Own | 15.96% | Inst Own | 97.24% |
| Insider Trans | -8.77% | Inst Trans | 0.28% |
| Short Float | 22.15% | Earnings | May 09/a |
| Analyst Recom | 1.11 | Target Price | 53.89 |
| Avg Volume | 623.34K | 52W Range | 9.44 - 36.25 |
|
|
|
|
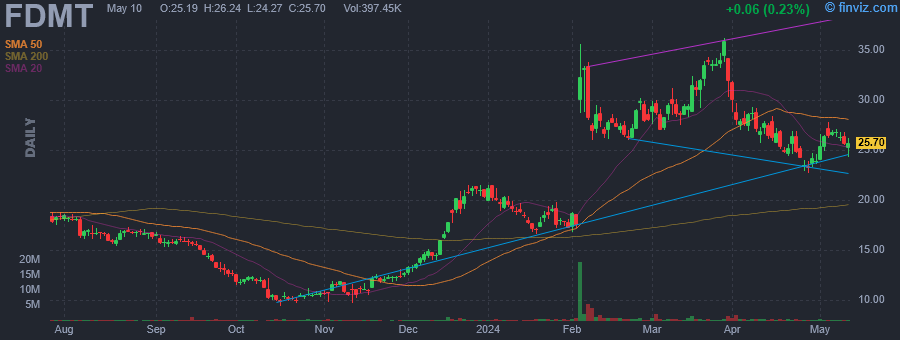
4D Molecular Therapeutics, Inc. is a clinical-stage biopharmaceutical company, which engages in the business of unlocking the full potential of genetic medicines to treat large market diseases in ophthalmology and pulmonology. The firm also offers product candidates focused on large market ophthalmology, pulmonology, and cardiology. The company was founded by David H. Kirn, Melissa Kotterman, Theresa Janke, and David Schaffer on September 12, 2013 and is headquartered in Emeryville, CA. |
| Insider Trading |
Relationship |
Date |
Transaction |
Cost |
#Shares |
Value ($) |
#Shares Total |
SEC Form 4 |
| Bizily Scott | Chief Legal Officer | May 16 '24 | Option Exercise | 7.60 | 1,750 | 13,295 | 3,487 | May 20 08:35 PM | | Bizily Scott | Chief Legal Officer | May 16 '24 | Sale | 25.45 | 1,750 | 44,541 | 1,737 | May 20 08:35 PM | | Bizily Scott | Chief Legal Officer | Apr 16 '24 | Option Exercise | 7.60 | 1,750 | 13,295 | 3,487 | Apr 18 08:48 PM | | Bizily Scott | Chief Legal Officer | Apr 16 '24 | Sale | 25.74 | 1,750 | 45,045 | 1,737 | Apr 18 08:48 PM | | Bizily Scott | Chief Legal Officer | Apr 01 '24 | Option Exercise | 12.54 | 8,153 | 102,224 | 9,890 | Apr 03 07:18 PM |
|
|
|
 |
| Market Cap | 85.47M | EPS (ttm) | -2.12 |
| P/E | - | EPS this Y | 81.99% |
| Forward P/E | - | EPS next Y | -3.40% |
| PEG | - | EPS past 5Y | 13.12% |
| P/S | 2.46 | EPS next 5Y | - |
| P/B | - | EPS Q/Q | 68.60% |
| Dividend | - | Sales Q/Q | 2131.40% |
| Insider Own | 8.38% | Inst Own | 66.95% |
| Insider Trans | -2.52% | Inst Trans | -0.29% |
| Short Float | 10.76% | Earnings | May 09/a |
| Analyst Recom | 2.60 | Target Price | 4.17 |
| Avg Volume | 1.65M | 52W Range | 0.20 - 2.54 |
|
|
|
|
Atara Biotherapeutics, Inc. is an allogeneic T-cell immunotherapy company, which engages in the development of transformative therapies for patients with serious diseases including solid tumors, hematologic cancers, and autoimmune diseases. It also delivers off-the-shelf treatments to patients with high unmet medical need. Its product pipeline includes Tab-cel, ATA188, ATA2271/ATA3271, and ATA3219. The company was founded by Isaac E. Ciechanover on August 22, 2012 and is headquartered in Thousand Oaks, CA. |
| Insider Trading |
Relationship |
Date |
Transaction |
Cost |
#Shares |
Value ($) |
#Shares Total |
SEC Form 4 |
| Touchon Pascal | President and CEO | May 16 '24 | Sale | 0.62 | 81,506 | 50,289 | 1,829,146 | May 20 08:34 PM | | Nguyen AnhCo | EVP, Chief Sci. & Tech Officer | May 16 '24 | Sale | 0.62 | 42,899 | 26,469 | 898,498 | May 20 08:34 PM | | Murugan Amar | EVP, Chief Legal Officer | May 16 '24 | Sale | 0.62 | 32,401 | 19,991 | 695,120 | May 20 08:33 PM | | Hyllengren Eric J | EVP, CFO | May 16 '24 | Sale | 0.62 | 28,648 | 17,676 | 645,671 | May 20 08:33 PM | | Henrich Jill | EVP, Global Head RA & Quality | May 16 '24 | Sale | 0.62 | 25,750 | 15,888 | 529,251 | May 20 08:32 PM |
|
|
| |
 |
| Market Cap | 340.57M | EPS (ttm) | -3.31 |
| P/E | - | EPS this Y | 0.57% |
| Forward P/E | - | EPS next Y | 7.96% |
| PEG | - | EPS past 5Y | -19.52% |
| P/S | - | EPS next 5Y | - |
| P/B | 0.91 | EPS Q/Q | -3.22% |
| Dividend | - | Sales Q/Q | - |
| Insider Own | 27.59% | Inst Own | 91.35% |
| Insider Trans | -0.58% | Inst Trans | -0.78% |
| Short Float | 18.61% | Earnings | May 16/b |
| Analyst Recom | 1.10 | Target Price | 13.40 |
| Avg Volume | 961.87K | 52W Range | 5.81 - 24.81 |
|
|
|
|
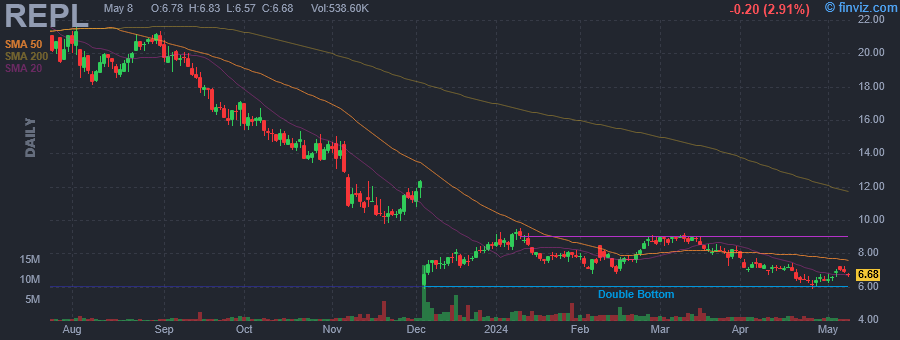
Replimune Group, Inc. is a clinical-stage biotechnology company. It engages in the business of developing oncolytic immunotherapies for the treatment of cancer. The company was founded by Philip Astley-Sparke, Colin A. Love, and Robert Coffin in March 2015 and is headquartered in Woburn, MA. |
| Insider Trading |
Relationship |
Date |
Transaction |
Cost |
#Shares |
Value ($) |
#Shares Total |
SEC Form 4 |
| Astley-Sparke Philip | Executive Chairman | May 16 '24 | Sale | 6.47 | 37,928 | 245,394 | 1,487,350 | May 20 08:04 PM | | Patel Sushil | Chief Executive Officer | May 16 '24 | Sale | 6.47 | 20,194 | 130,655 | 212,014 | May 20 08:01 PM | | Love Colin | Chief Operating Officer | May 16 '24 | Sale | 6.47 | 17,615 | 113,969 | 777,345 | May 20 08:05 PM | | Coffin Robert | Director | May 16 '24 | Sale | 6.47 | 11,464 | 74,172 | 1,821,872 | May 20 08:02 PM | | Xynos Konstantinos | Chief Medical Officer | May 16 '24 | Sale | 6.47 | 6,367 | 41,194 | 133,012 | May 20 08:00 PM |
|
|
|
 |
| Market Cap | 319.96M | EPS (ttm) | -1.52 |
| P/E | - | EPS this Y | 110.81% |
| Forward P/E | 8.81 | EPS next Y | 68.42% |
| PEG | - | EPS past 5Y | - |
| P/S | 1.31 | EPS next 5Y | - |
| P/B | 0.80 | EPS Q/Q | 120.38% |
| Dividend | - | Sales Q/Q | -12.46% |
| Insider Own | 53.38% | Inst Own | 9.12% |
| Insider Trans | 0.47% | Inst Trans | 0.10% |
| Short Float | 2.27% | Earnings | May 10/b |
| Analyst Recom | 1.00 | Target Price | 9.00 |
| Avg Volume | 139.56K | 52W Range | 4.07 - 9.22 |
|
|
|
|
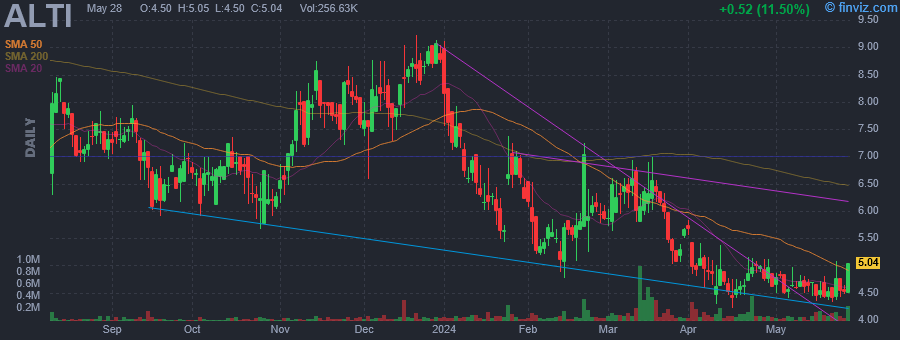
AlTi Global, Inc. is a financial services company, which engages in the provision of investment, advisory, and administrative services. The company was founded on December 18, 2020 and is headquartered in New York, NY. |
| Insider Trading |
Relationship |
Date |
Transaction |
Cost |
#Shares |
Value ($) |
#Shares Total |
SEC Form 4 |
| Tiedemann Michael | Chief Executive Officer | May 20 '24 | Buy | 4.54 | 40,000 | 181,600 | 409,146 | May 20 08:22 PM | | Tiedemann Michael | Chief Executive Officer | May 16 '24 | Buy | 4.66 | 60,000 | 279,600 | 369,146 | May 20 08:22 PM | | Keaney Timothy F | President, Asset Management | May 16 '24 | Buy | 4.60 | 16,417 | 75,518 | 97,321 | May 16 09:34 PM | | Maliagros Spiros | President, Asset Management | May 16 '24 | Sale | 4.62 | 13,604 | 62,850 | 499,381 | May 20 04:16 PM | | Moran Kevin P. | See Remarks | May 16 '24 | Sale | 4.70 | 10,047 | 47,221 | 165,137 | May 20 08:05 PM |
|
|
|
 |
| Market Cap | 13.40B | EPS (ttm) | 2.48 |
| P/E | 46.16 | EPS this Y | -199.43% |
| Forward P/E | - | EPS next Y | 62.93% |
| PEG | - | EPS past 5Y | - |
| P/S | 1.19 | EPS next 5Y | - |
| P/B | 46.22 | EPS Q/Q | 115.30% |
| Dividend | - | Sales Q/Q | 17.46% |
| Insider Own | 16.06% | Inst Own | 91.68% |
| Insider Trans | -7.38% | Inst Trans | 1.23% |
| Short Float | 27.96% | Earnings | May 01/a |
| Analyst Recom | 2.91 | Target Price | 105.30 |
| Avg Volume | 6.10M | 52W Range | 10.34 - 129.00 |
|
|
|
Today 09:00AM
|
Carvana Announces Investor Tour at its Rocklin, CA Inspection and Reconditioning Center
(Business Wire) |
|
03:24AM
|
Carvana Insider Sold Shares Worth $14,229,958, According to a Recent SEC Filing
(MT Newswires) |
|
May-20-24 09:40AM
|
Are Retail-Wholesale Stocks Lagging Carvana (CVNA) This Year?
(Zacks) |
|
09:00AM
|
1 Unstoppable Growth Stock Up 945%: Is It a Missed Opportunity?
(Motley Fool) |
|
May-17-24 03:21AM
|
Carvana Insider Sold Shares Worth $14,421,428, According to a Recent SEC Filing
(MT Newswires) |
|
May-16-24 08:05PM
|
Missed the 2,400% Run-Up in Carvana? 3 More Beaten-Down Stocks Ready to Zoom Higher
(InvestorPlace) |
|
May-15-24 12:57PM
|
Carvana Expects Surge In Used Car Demand On New Vehicle Oversupply
(Benzinga) |
|
09:00AM
|
Carvana Co. (CVNA) Is a Trending Stock: Facts to Know Before Betting on It
(Zacks) |
|
06:04AM
|
Why the 2024 meme stock action is much tamer than 2021 so far
(Yahoo Finance) |
|
May-14-24 05:40PM
|
Carvana Insider Sold Shares Worth $14,168,404, According to a Recent SEC Filing
(MT Newswires) |
|
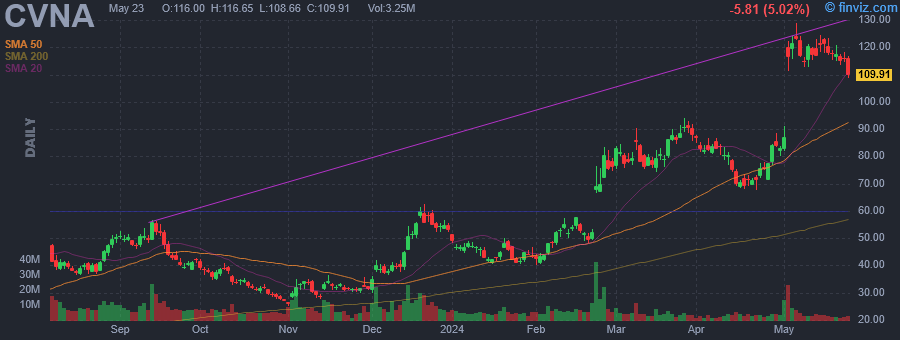
Carvana Co. is a holding company and an eCommerce platform, which engages in the buying and selling of used cars. The company was founded by Ernest Garcia, III, Benjamin Huston and Ryan Keeton in 2012 and is headquartered in Tempe, AZ. |
| Insider Trading |
Relationship |
Date |
Transaction |
Cost |
#Shares |
Value ($) |
#Shares Total |
SEC Form 4 |
| GARCIA ERNEST C. II | 10% Owner | May 17 '24 | Sale | 117.02 | 60,000 | 7,021,113 | 2,377,500 | May 20 08:02 PM | | GARCIA ERNEST C. II | 10% Owner | May 16 '24 | Sale | 120.15 | 60,000 | 7,208,845 | 2,437,500 | May 20 08:02 PM | | GARCIA ERNEST C. II | 10% Owner | May 15 '24 | Sale | 120.10 | 60,000 | 7,205,838 | 2,497,500 | May 16 06:50 PM | | GARCIA ERNEST C. II | 10% Owner | May 14 '24 | Sale | 120.26 | 60,000 | 7,215,590 | 2,557,500 | May 16 06:50 PM | | GARCIA ERNEST C. II | 10% Owner | May 13 '24 | Sale | 119.27 | 60,000 | 7,156,031 | 2,617,500 | May 14 05:26 PM |
|
|
|
