Chart pattern is a term of technical analysis used to analyze a
stock's price action according to the shape its price chart creates.
Trading by chart patterns is based on the premise that once a chart
forms a pattern the short term price action is predictable to an
extent. For instance, if a chart creates a "channel" the stock price
will be bouncing off the upper and lower boundary until it breaks out.
Based on each pattern's rules many different trading strategies can be
applied. The following list describes the most common trendline-based
chart patterns.
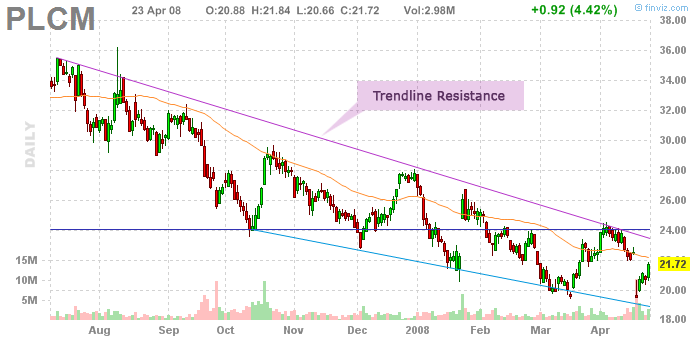
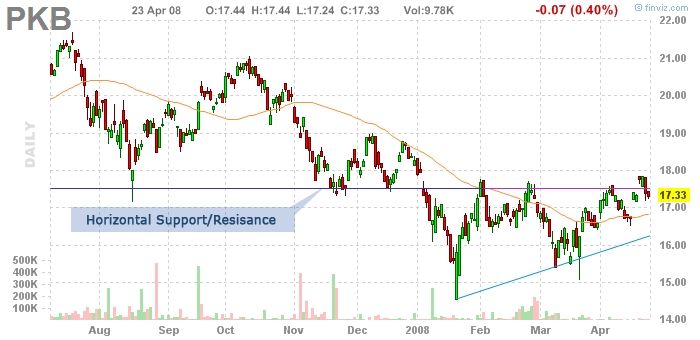
Trendlines
Trendlines represent a basic yet the most popular chart pattern used by
technical traders. The pattern is defined as local highs or local lows
forming a straight line. Trendlines can be composed of highs
(resistance) or lows (support). The basic rule is that a stock's price
bounces upward off a trendline support, and downward off a trendline
resistance. When a trendline is broken, especially on a high volume,
the gained momentum will push the stock significantly above/below the
broken trendline.
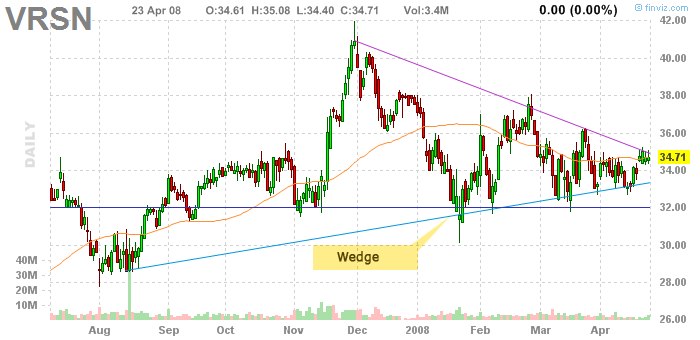
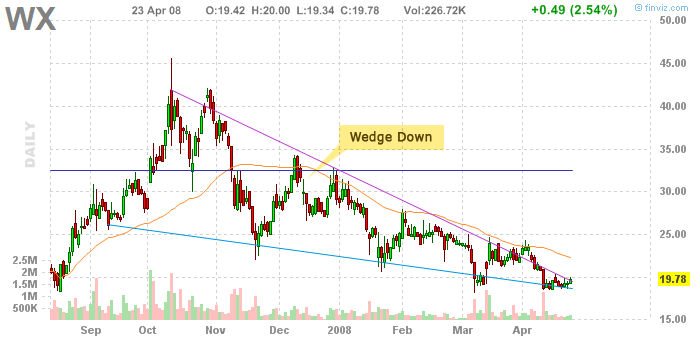
Wedge Patterns
Wedge patterns are composed of converging trendline support and trendline resistance.
If price breaks out in the same direction of the prior trend, the pattern is defined as "continuation".
If price breaks out in the opposite direction of the prior trend, the pattern is defined as "reversal".
Wedge Up - upward trendline support and upward trendline resistance (reversal)
Wedge - upward trendline support, downward trendline resistance (continuation)
Wedge Down - downward trendline support and downward trendline resistance (reversal)
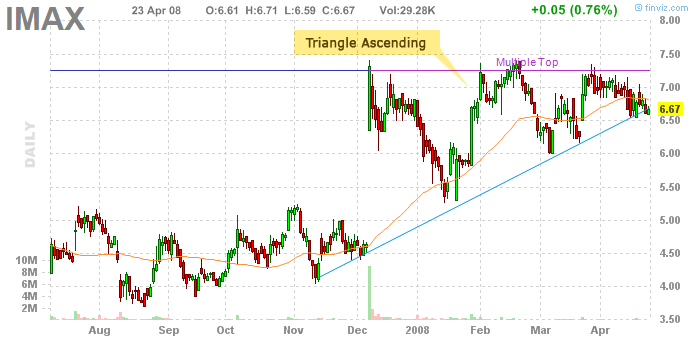
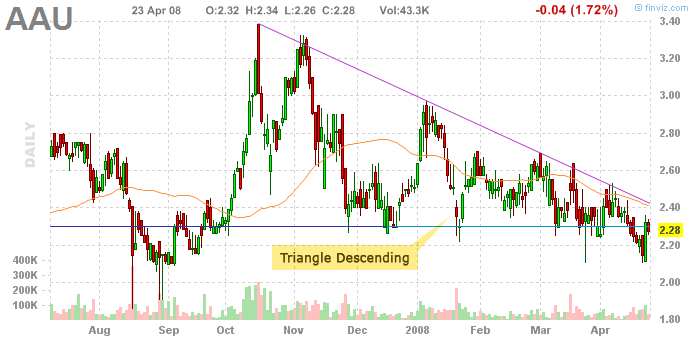
Triangle Patterns (continuation)
Triangle patterns are composed of converging trendline support and
trendline resistance, where one of the trendlines is horizontal.
Triangle Ascending - upward trendline support and horizontal trendline resistance
Triangle Descending - horizontal trendline support and downward trendline resistance
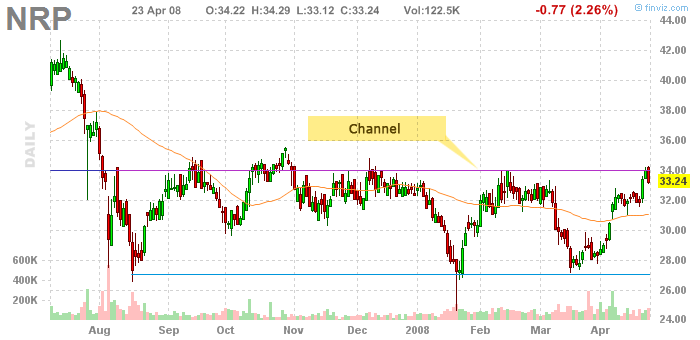
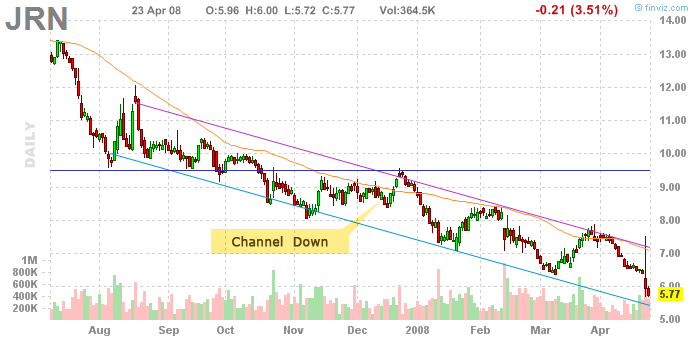
Channel Patterns (continuation)
Channel patterns are composed of parallel trendline support and trendline resistance.
Channel Up - both support and resistance trendlines slope upward
Channel - both support and resistance trendlines are horizontal
Channel Down - both support and resistance trendlines slope downward
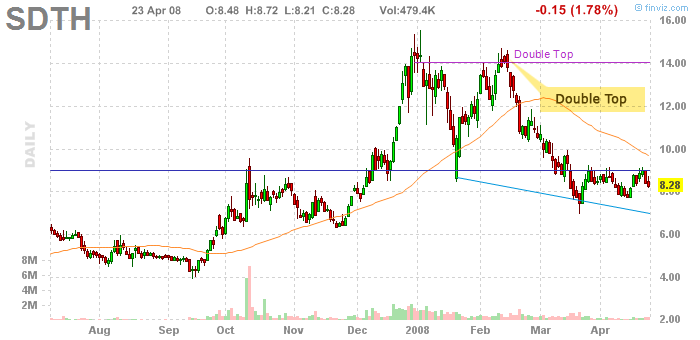
Double Top, Multiple Top (reversal)
The double top and multiple top trend-reversal patterns are defined by:
1. prior uptrend
2. horizontal resistance consisting of two equal highs (double top), three and more equal highs (multiple top)
3. horizontal support defined by the low of the pattern's period (starting at the first and ending at the last top)
4. break of the horizontal support signals completion of the prior uptrend reversal
Common trading rules for double and multiple tops:
- The entry (sell short) should be placed bellow the break of the horizontal support (3.), preferably on an increased volume.
- The price target's distance is defined by the pattern's height = resistance (2.) - support (3.)
- The horizontal support (3.) may turn into short-term resistance.
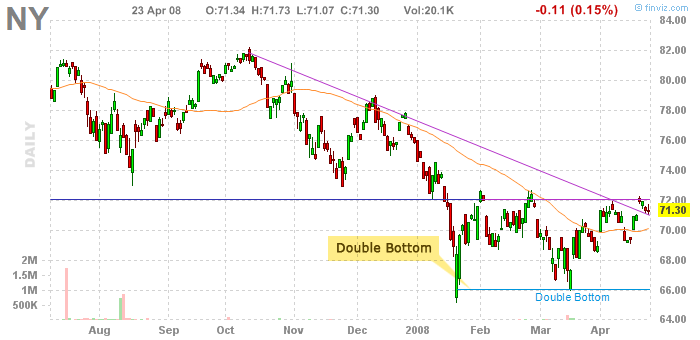
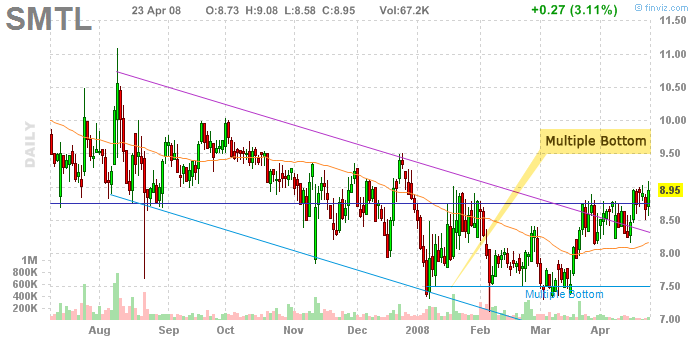
Double Bottom, Multiple Bottom (reversal)
The double bottom and multiple bottom trend-reversal patterns are defined by:
1. prior downtrend
2. horizontal support consisting of two equal lows (double bottom), three and more equal lows (multiple bottom)
3. horizontal resistance defined by the high of the pattern's period (starting at the first and ending at the last low)
4. break of the horizontal resistance signals completion of the prior downtrend reversal
Common trading rules for double and multiple bottoms:
- The entry (buy long) should be placed above the break of the horizontal resistance (3.), preferably on an increased volume.
- The price target's distance is defined by the pattern's height = resistance (3.) - support (2.)
- The horizontal resistance (3.) may turn into short-term support.
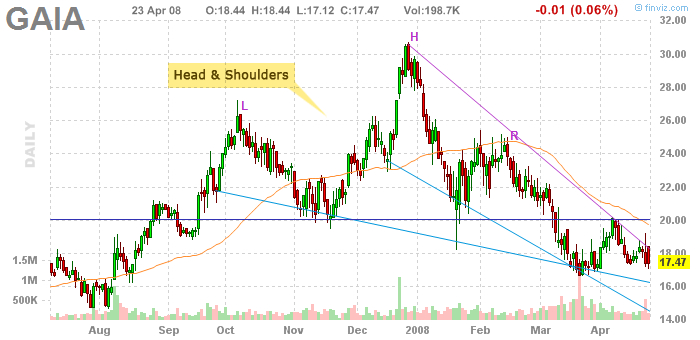
Head & Shoulders (reversal)
The Head & Shoulder trend-reversal pattern is defined by:
1. prior uptrend
2. three distinct highs - left shoulder, head, right shoulder (head being the highest, shoulders of the same height)
3. horizontal support defined by the low of the pattern's period
(starting at the left shoulder and ending at the right shoulder)
4. break of the horizontal support (3.) signals completion of the prior uptrend reversal
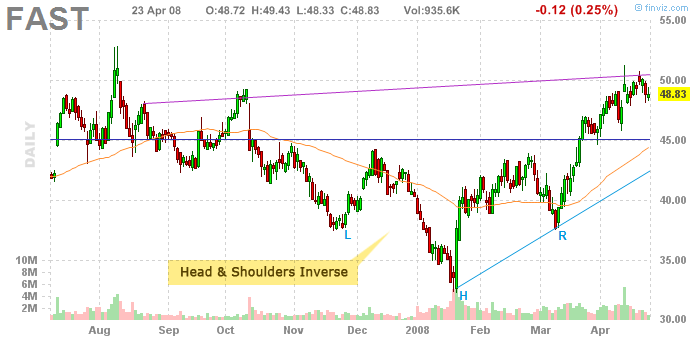
The Head & Shoulder Inverse pattern is the exact opposite.