Technical Indicators Backtests
In this article we are going to present the results of a vast backtest of technical analysis indicators, whose functions we explained above. Which of them are really useful in the stock market? And which ones are better left ignored? You will find the results of our test in form of concise tables, along with accompanying comments.
Introduction
Our test takes the form of a backtest, i. e. it tests the signals generated by indicators on the past data for the period from January 1, 1995 to July 17, 2009. The data contain all stocks of publicly traded companies in the US, which makes totally 16,954 stocks. The data contain also delisted companies (i.e. companies that were later taken away from exchange trading, usually due to bad performance of the company).
However, these companies also comprise so called "penny stocks", i.e. stocks of very small companies that have very limited liquidity in the market and hence are often subject to price manipulation or simply contain errors in the data. Hence, we have set a condition for a trade to be executed, which says that the stock price always has to be higher than 1 dollar and also that the volume traded in the market for the particular day has to be higher than 100,000. Thus, we ensure that only liquid stocks, whose price is not prone to unjustified gaps and manipulation, will be tested.
During most of the time of the period taken into account a strong upward trend was present in the market, which results in buy signals generated by the indicators being generally much more successful than sell signals. Our approach to the test reflects this fact: the indicators are tested with various settings always for three time periods - 5, 10 and 20 days. This means that the exit from a trade occurs automatically 5, 10 or 20 days after the entry signal had been generated. Thus, we ensure objective testing of all indicators in the test.
We tested signals for opening a long position (buy) , as well as signals for a short position (sell). Results of trading during the historical period were compared to the results of random buying or selling for the particular time of holding the position (e.g. if testing performance of RSI for selling signals and subsequent holding the position for 5 days, we compare the results to the random sell and hold for 5 days). In order to make the results easier to interpret, we add to the table the column containing the value of a paired t-test. This statistic tests the dependency between results obtained by the particular indicator and the respective random value. If this value is close to 0, indicator's results are very close to the results of random trading. If the t-statistic is smaller than 0, it means that the signals generated by the indicator were less profitable than random trading, which means that the indicator is basically useless. Conversely, if the t-statistic is higher than 0, it means that the indicator yielded signals that were more profitable than random trading and hence is useful. The higher the t-value, the bigger the results of the indicator and random trading. Hence, indicators with highest positive t-values are the most successful ones. However, we do not take commissions and other trading fees into consideration in our test, as we are testing only single indicators and not a complete trading system.
The table of test results contains following columns: Trades, Avg p/l, Win %, Avg win, Loss %, Avg loss and T-test.
The first column contains settings of the tested indicator and also the time, during which the position is held open.
Column Trades contains the total number of trades for the tested period for which the indicator generated entry signals.
Column Avg p/l represents the difference between profits and losses from trading with the particular indicator. If it is positive, it means that profits from profitable trades are higher than losses from losing trades. The higher this ratio, the better. However, if this ratio is negative, it means that losses are higher than profits and hence the indicator is losing money.
Further, we have the Win% column, which represents the percentage of trades that ended up with a profit. Average win represents average profit on one trade expressed as a percentage.
Similarly, columns Loss % and Average loss denote the percentage of losing trades and the average loss attained. However, the sum of Win% and Loss% does not have to be 100%. It is so because many trades result in neither a gain nor a loss, but instead break even.
The last column T-test contains the results of a paired T-test. It is a statistical test used to compare two sets of data. We use it to compare the results of trading with the particular settings of the indicator to random trading, in order to rule out the bias in results and also to prove statistical significance of the result. If the value is close to 0, it implies that the results of our trading are in fact random. In case the statistic is negative, it means that the indicator attains worse results than random trading and conversely, if it is positive, the indicator is more successful than random trading.
Test results
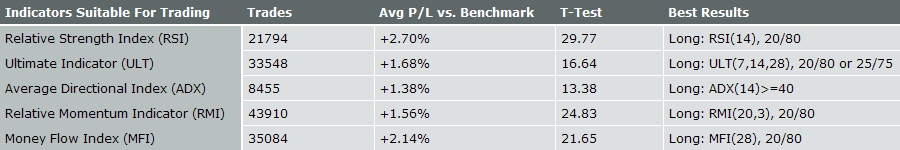
According to our test, clearly the more successful indicator is the Relative Strength Index (RSI). Besides, Ultimate oscillator and Average Directional Movement (ADX) work pretty reliably, as well. Relative Momentum Index (RMI) and Money Flow Index (MFI) also show reasonable success, especially while signaling long positions (buy). Rest of the indicators generates signals, whose success rate is similar to that of random trading, sometimes even lower.
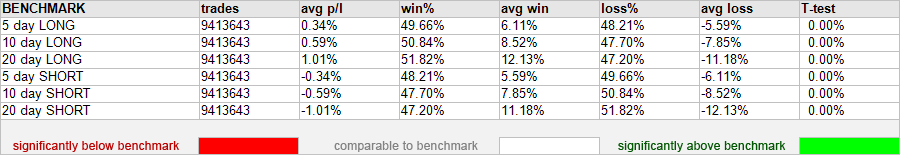
Benchmark
We use 6 types of trades as a benchmark - random buy and hold for 5, 10 and 20 days. We also use random sell and hold for these time periods. The results imply that the most useful random strategy was buy and hold for 20 days. This is the case because during most of the examined period there was a strong bullish trend in effect. Hence, while analyzing the results of the test, one has to take into account that buy signals will be overall more successful than sell signals and that's why they have to be judged more strictly.
Simple Moving Average
Exponential Moving Average
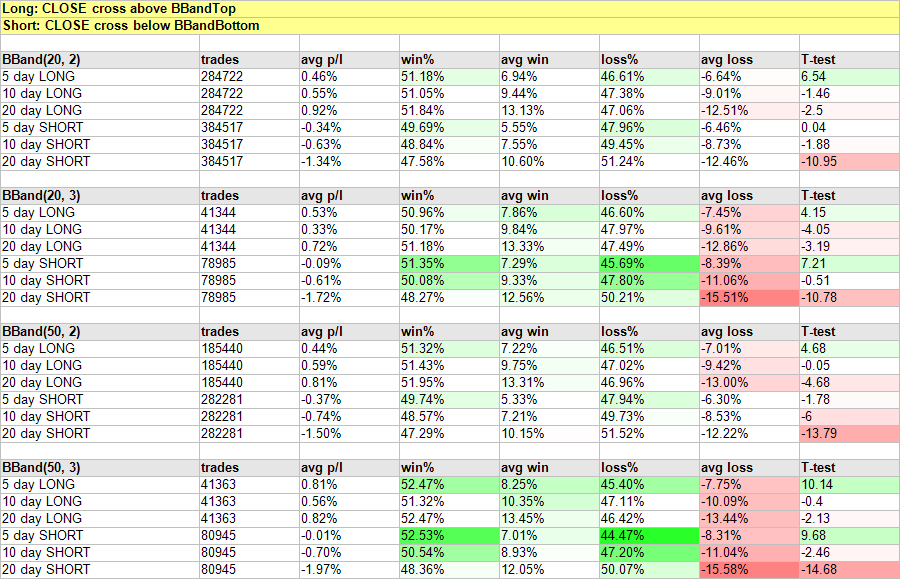
Bollinger Bands
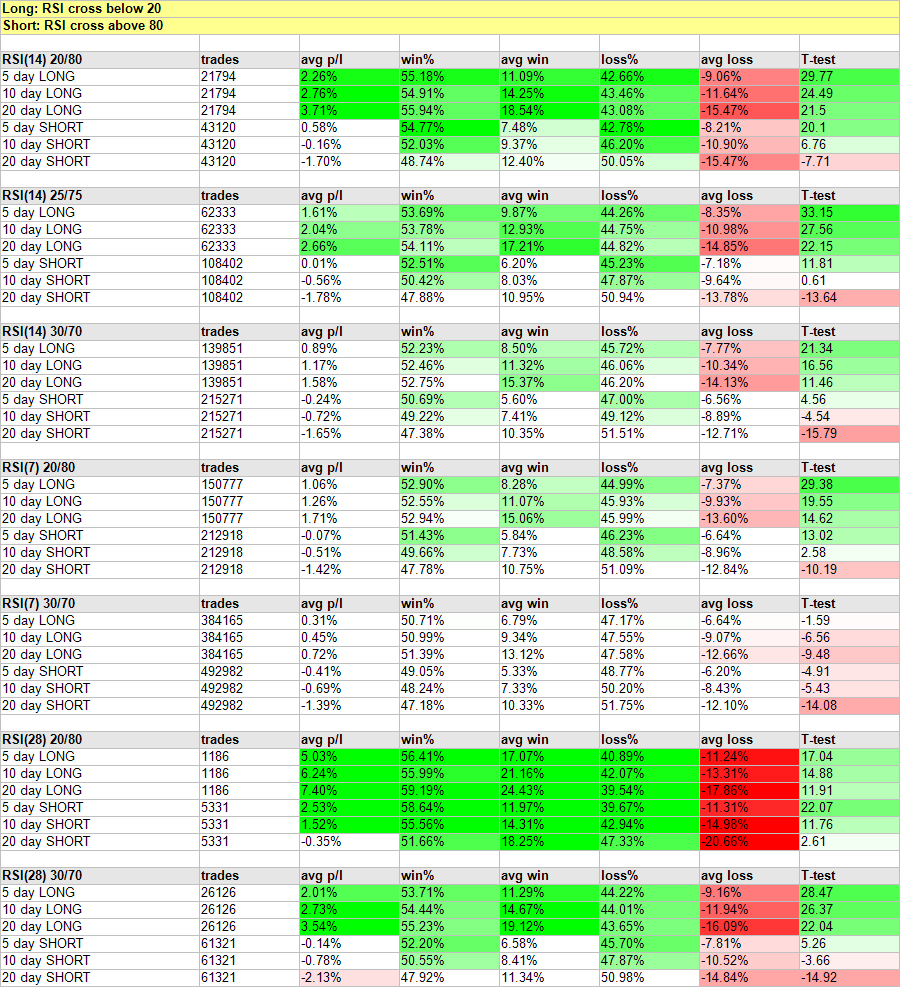
Relative Strength Index (RSI)
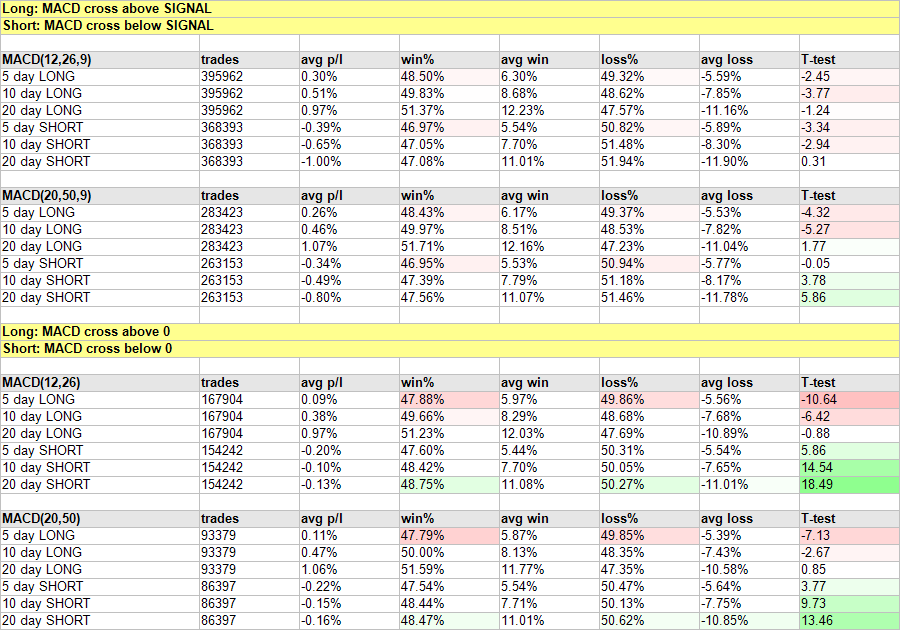
Moving Average Convergence/Divergence (MACD)
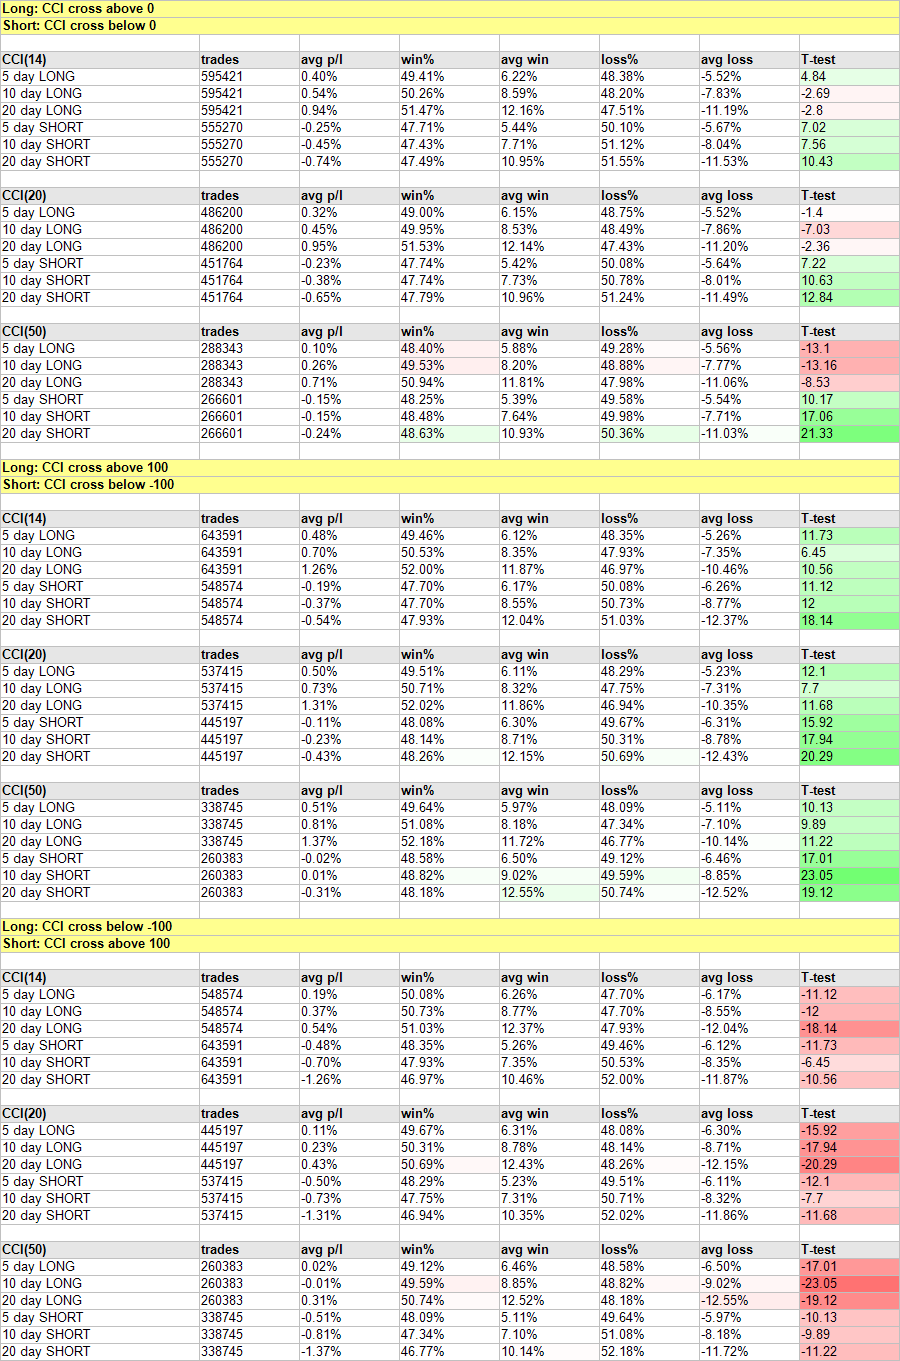
Commodity Channel Index (CCI)
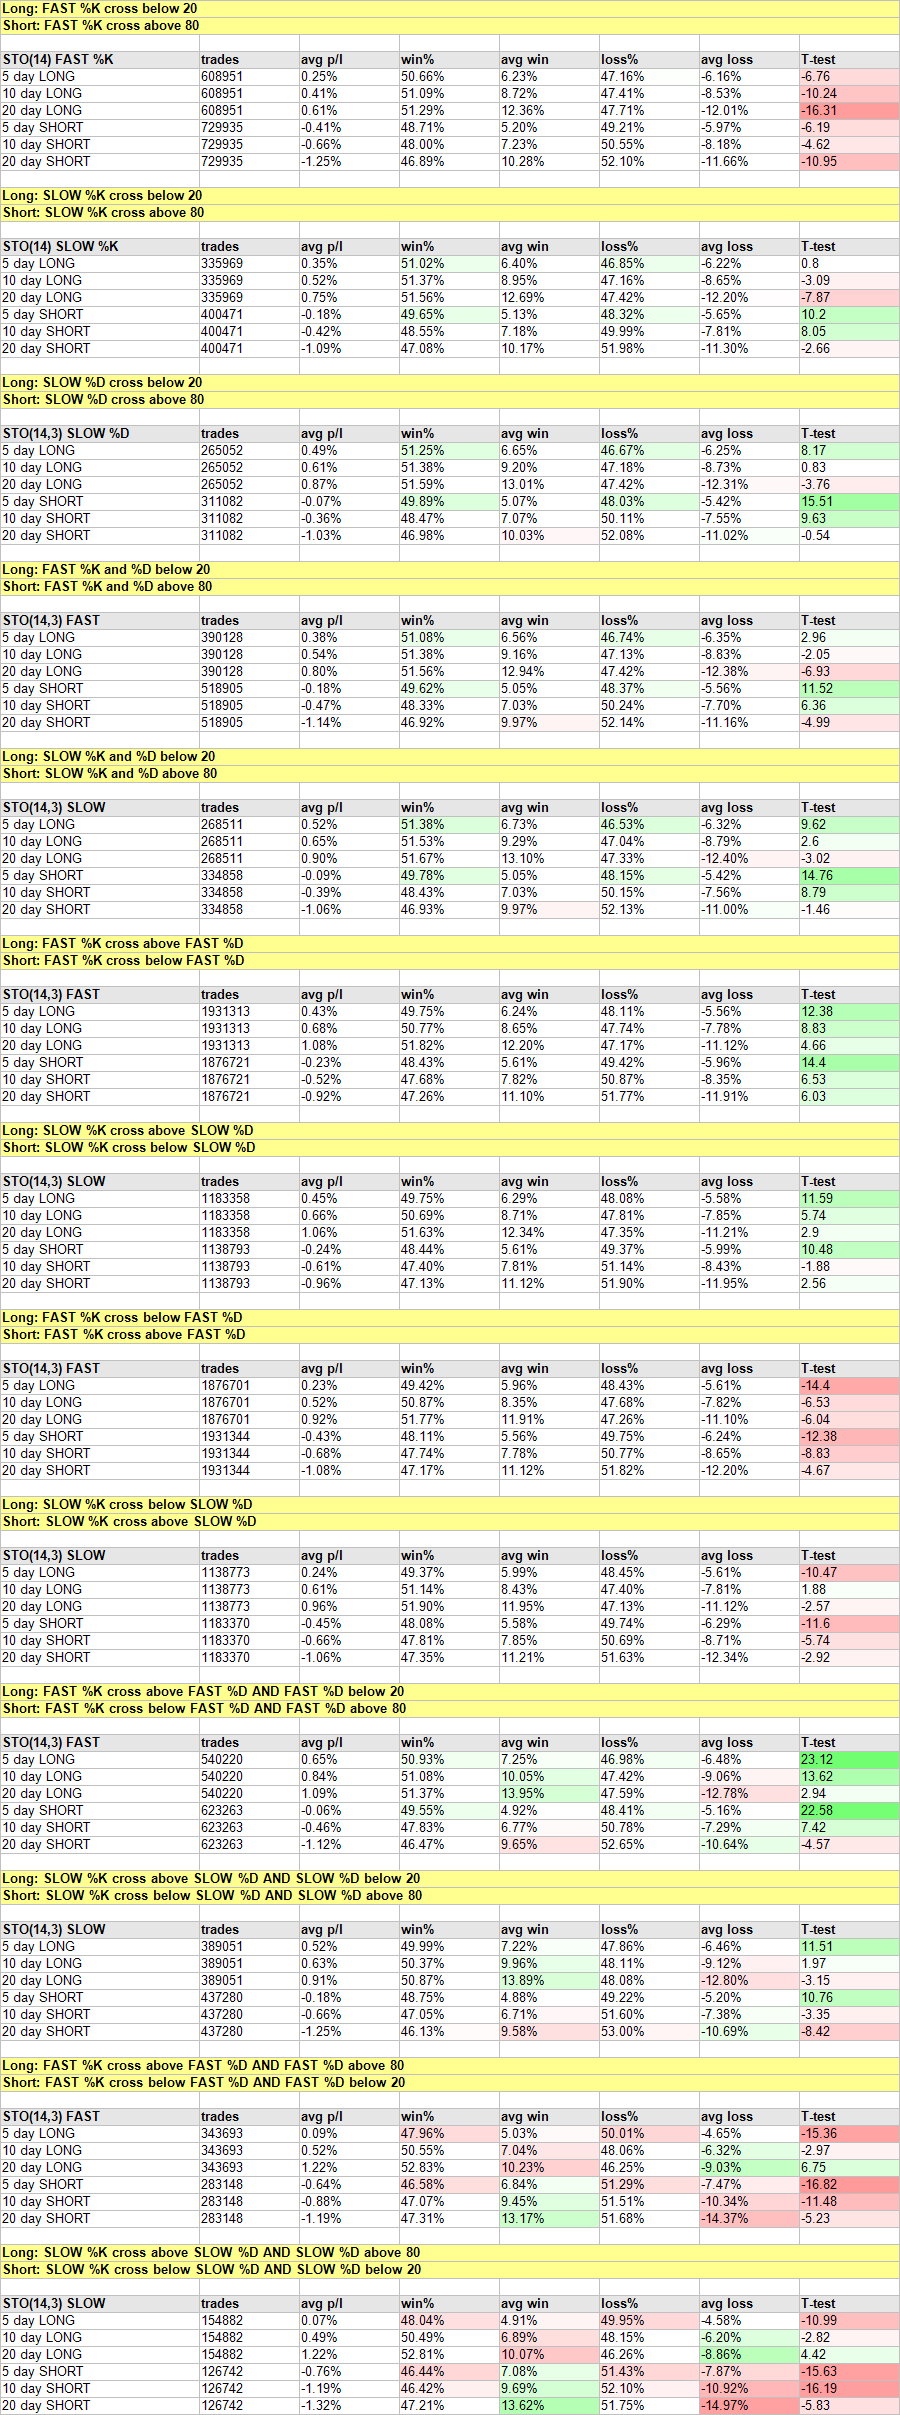
Stochastics (STO)
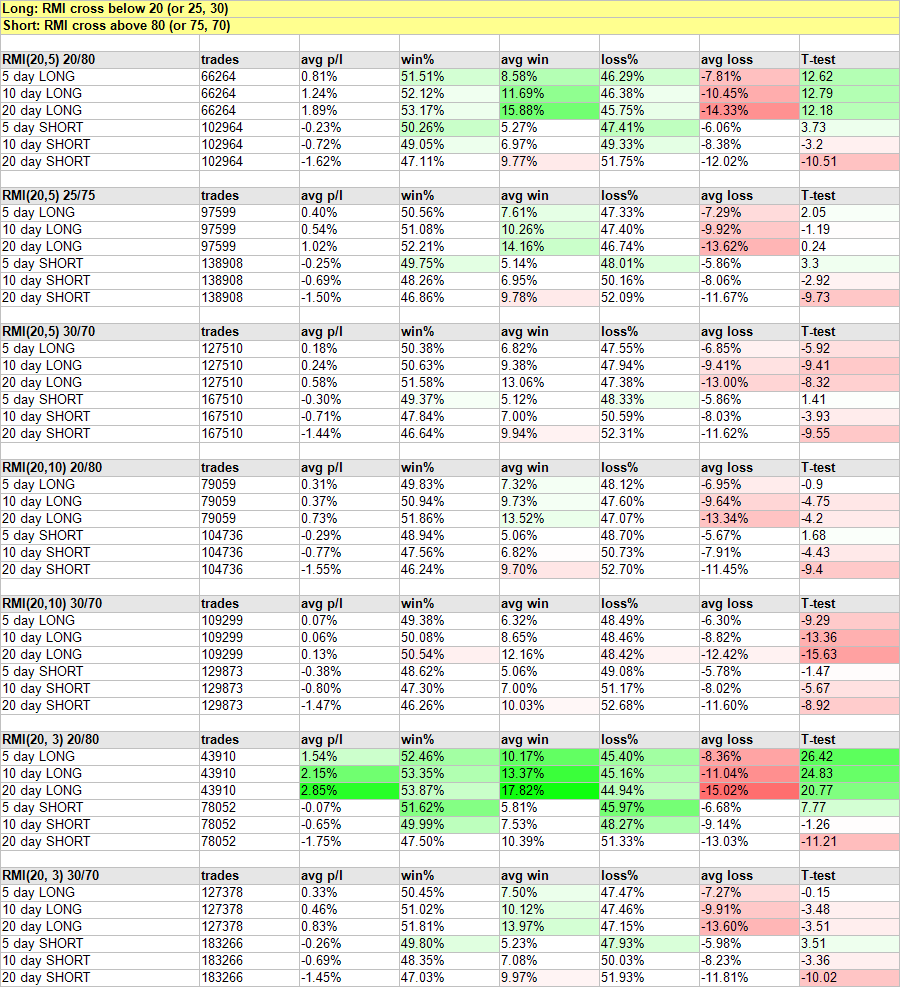
Relative Momentum Index (RMI)
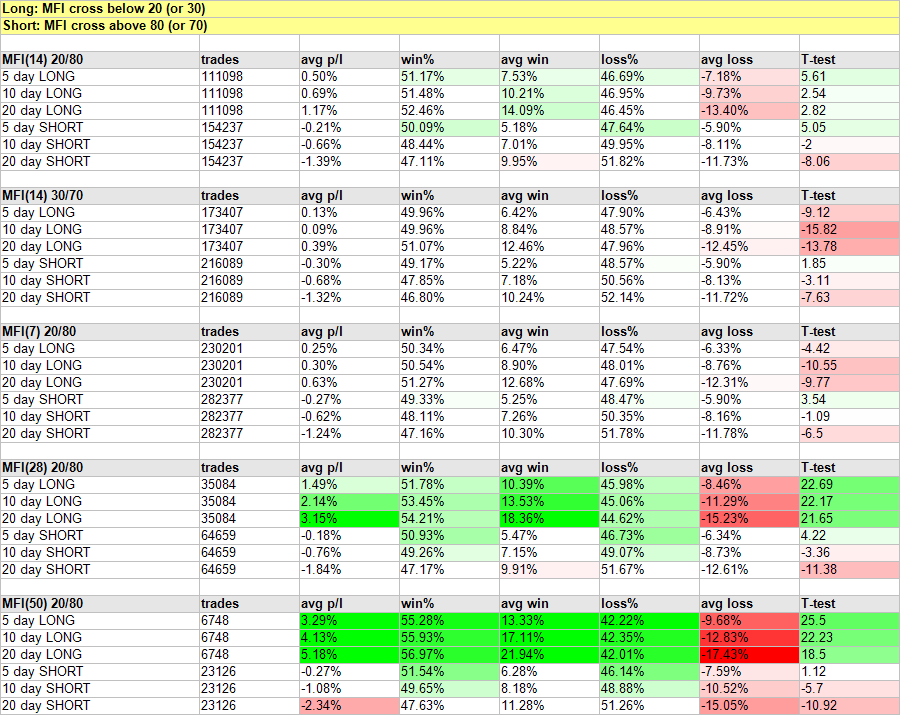
Money Flow Index (MFI)
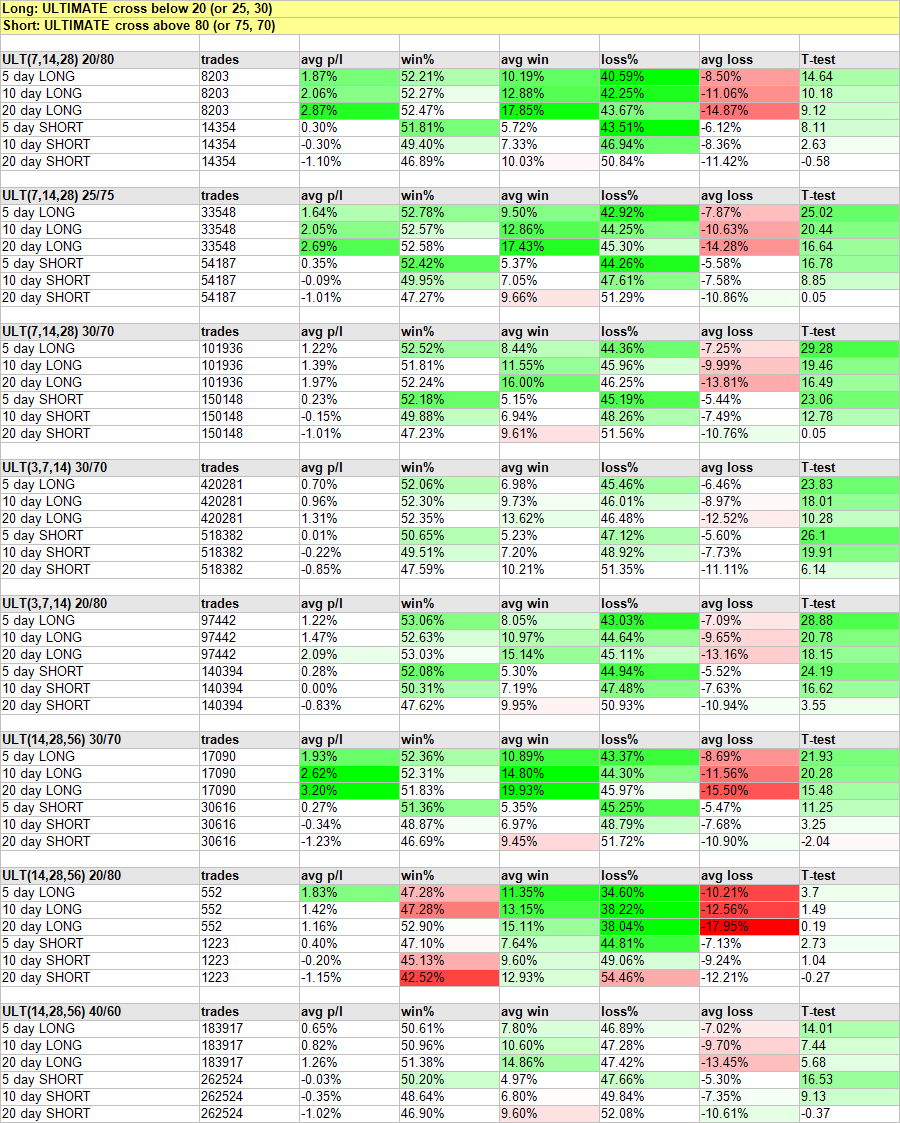
Ultimate Indicator
Triple Exponential Average (TRIX)
Williams %R
Force Index
Parabolic Stop-And-Reversal (SAR)
Average Directional Index (ADX)
Results of the particular indicators in the test
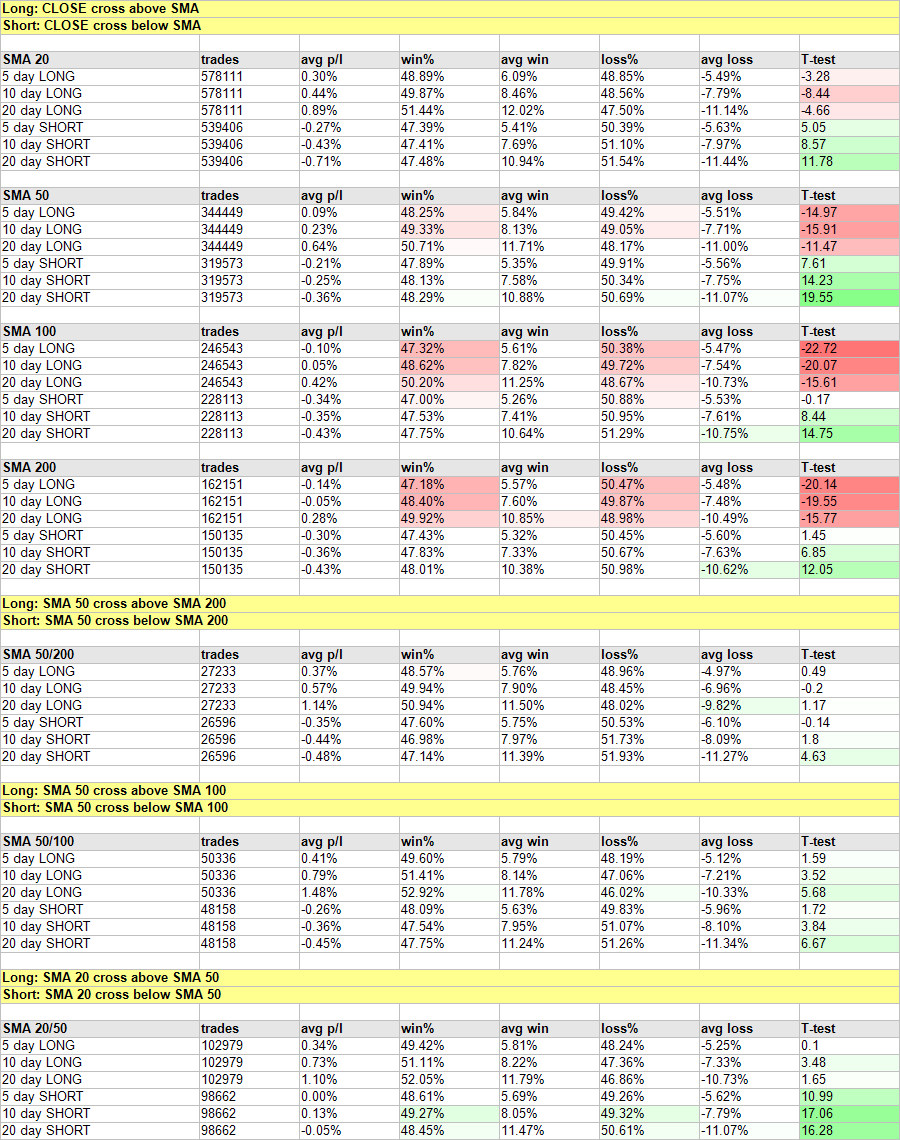
Simple Moving Average (SMA)
In most cases it showed worse results than random trading. Sometimes it performed similarly to the benchmark, but never better. The test implies that this indicator is useless.
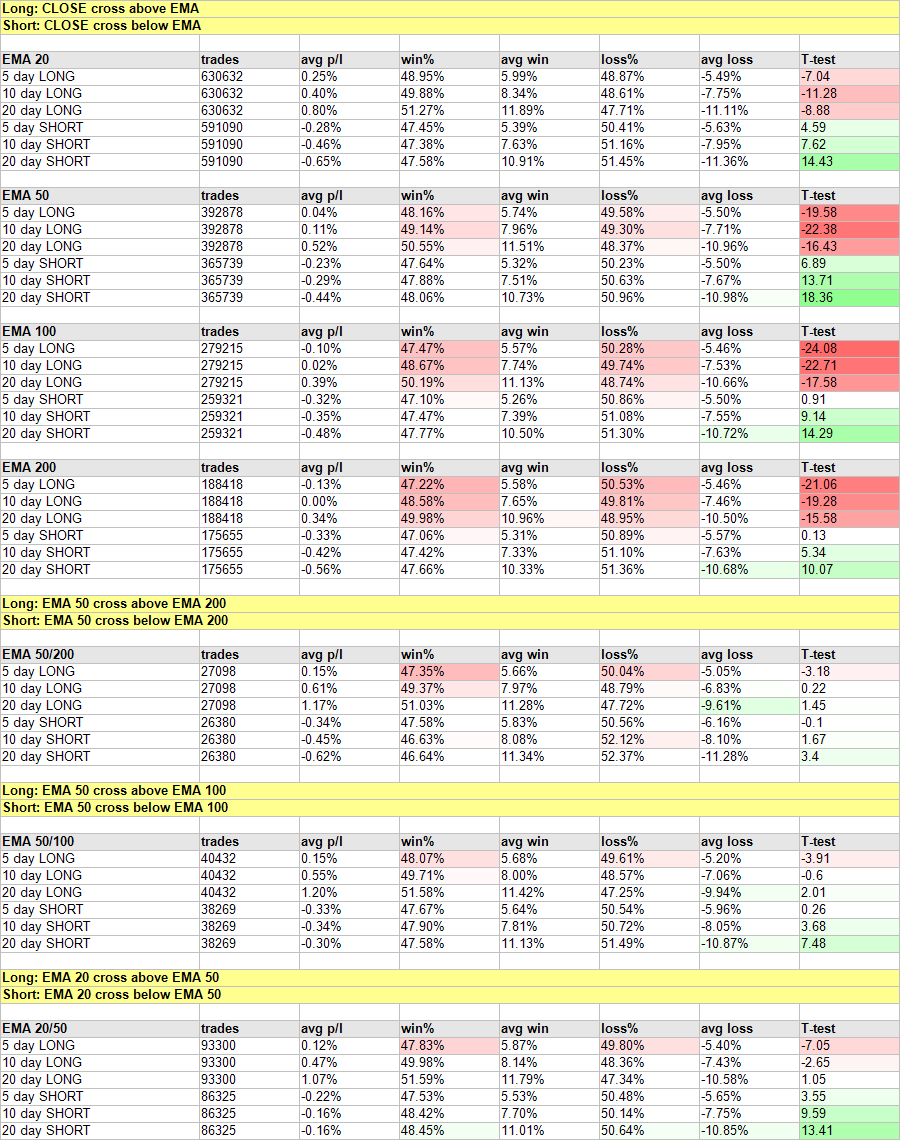
Exponential Moving Average (EMA)
It shows better results than random trading for 10 and 20 day sell signals. Nonetheless, these trades still generate substantial losses. This implies that EMA is not suitable for trading.
Relative Strength Index (RSI)
Is the best functioning indicator in our test. Using this indicator, one could have earned big profits. The setting that works best with this indicator is 14, 20/80. However, also this indicators has problems with trading short positions for a period longer than 5 days. It is probably due to stocks that record a steep rise while our short trade is still open and hence generate us high losses.
Commodity Channel Index (CCI)
This indicators lags the benchmark and if it beats the benchmark, it still generates losses.
Moving Average Convergence-Divergence (MACD)
The successfullness of this indicator is generally very low, which was verified by our research, as well.
Stochastics
This indicator beats the benchmark with several types of settings for 5-day short positions. In spite of that, it is still not profitable, so it did not prove worthy. In this case, a statistical error may be present.
Relative Momentum Index (RMI)
One of the more successful indicators. It works very well with the setting (20, 3) 20/80 for the long positions and also generates good profits. However, it is not profitable for short sales.
Money Flow Index (MFI)
It significantly beats the benchmark with the settings (28) 20/80 and (50) 20/80 in trading long positions for all the periods. But it generates losses for short positions.
Ultimate oscillator
Works reliably for long positions with the settings (7,14,28) 20/80 and (7,14,28) 25/75.
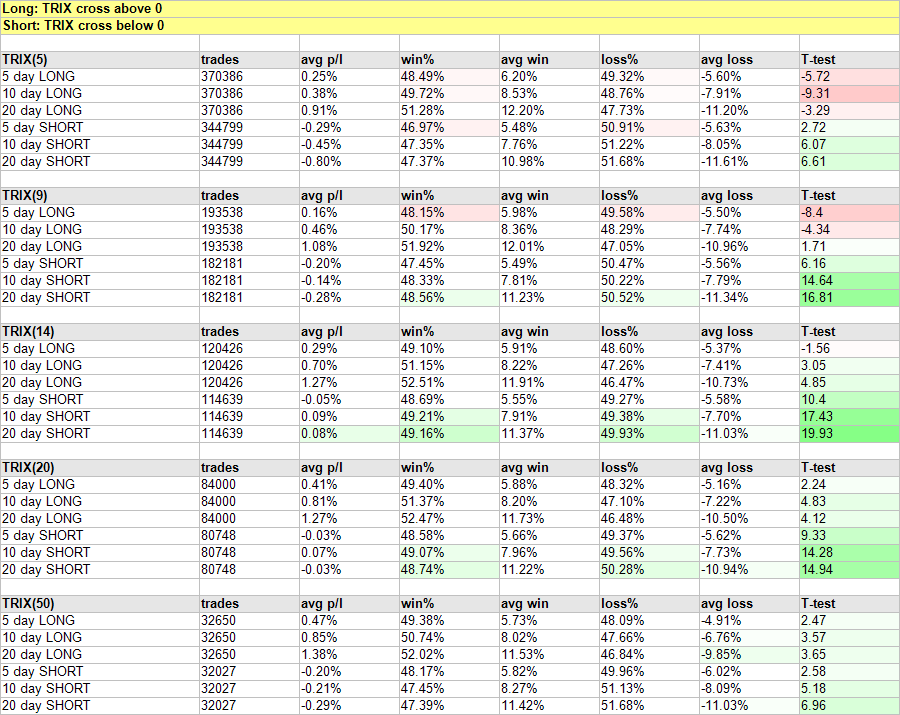
TRIX
14-day TRIX clearly beats the benchmark in short sales. Yet, the trades still generate losses.
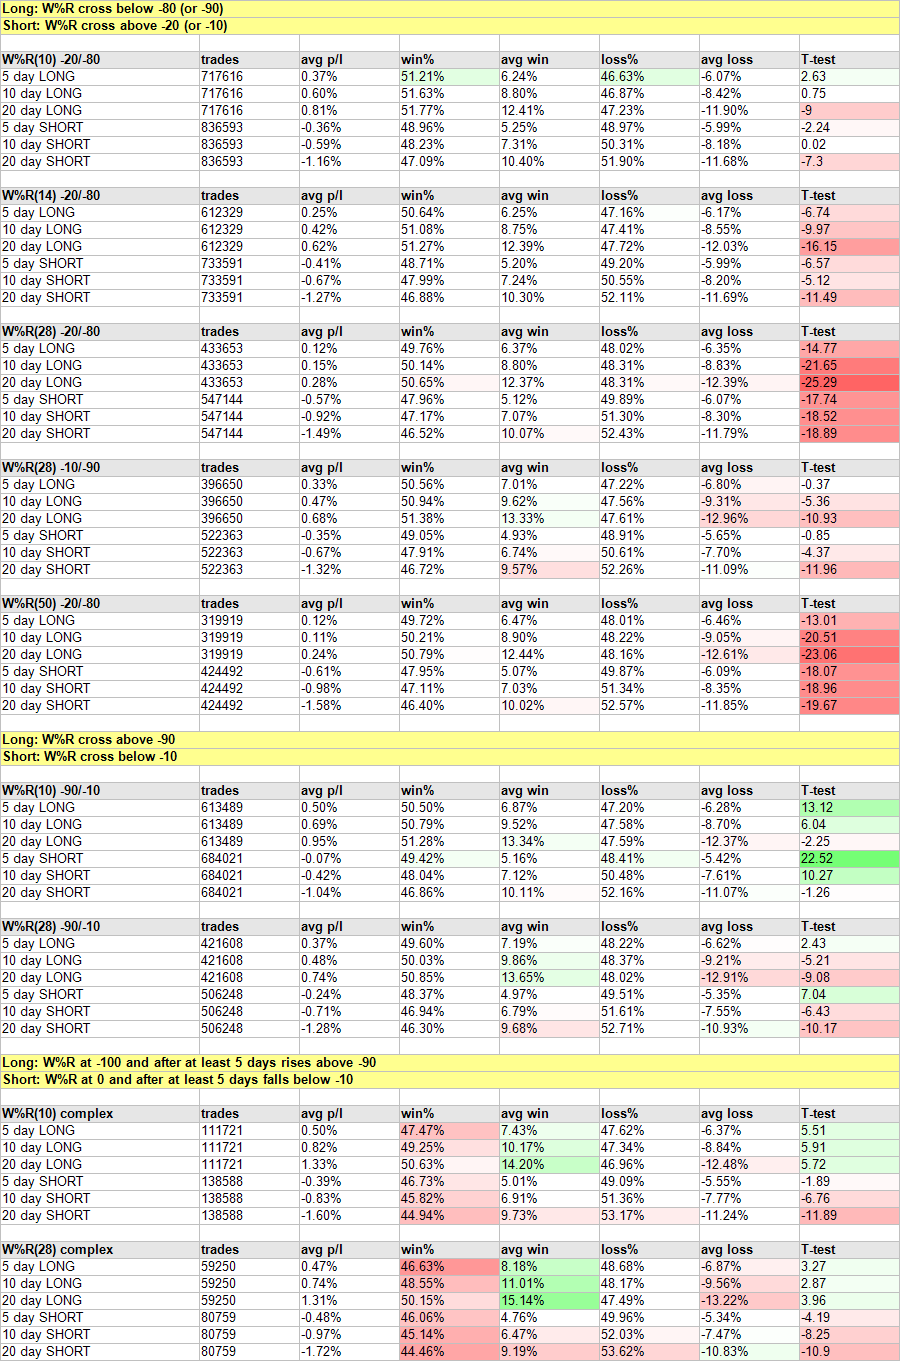
Williams %R
The indicator is not persuasive at all. Results are comparable to random trading.
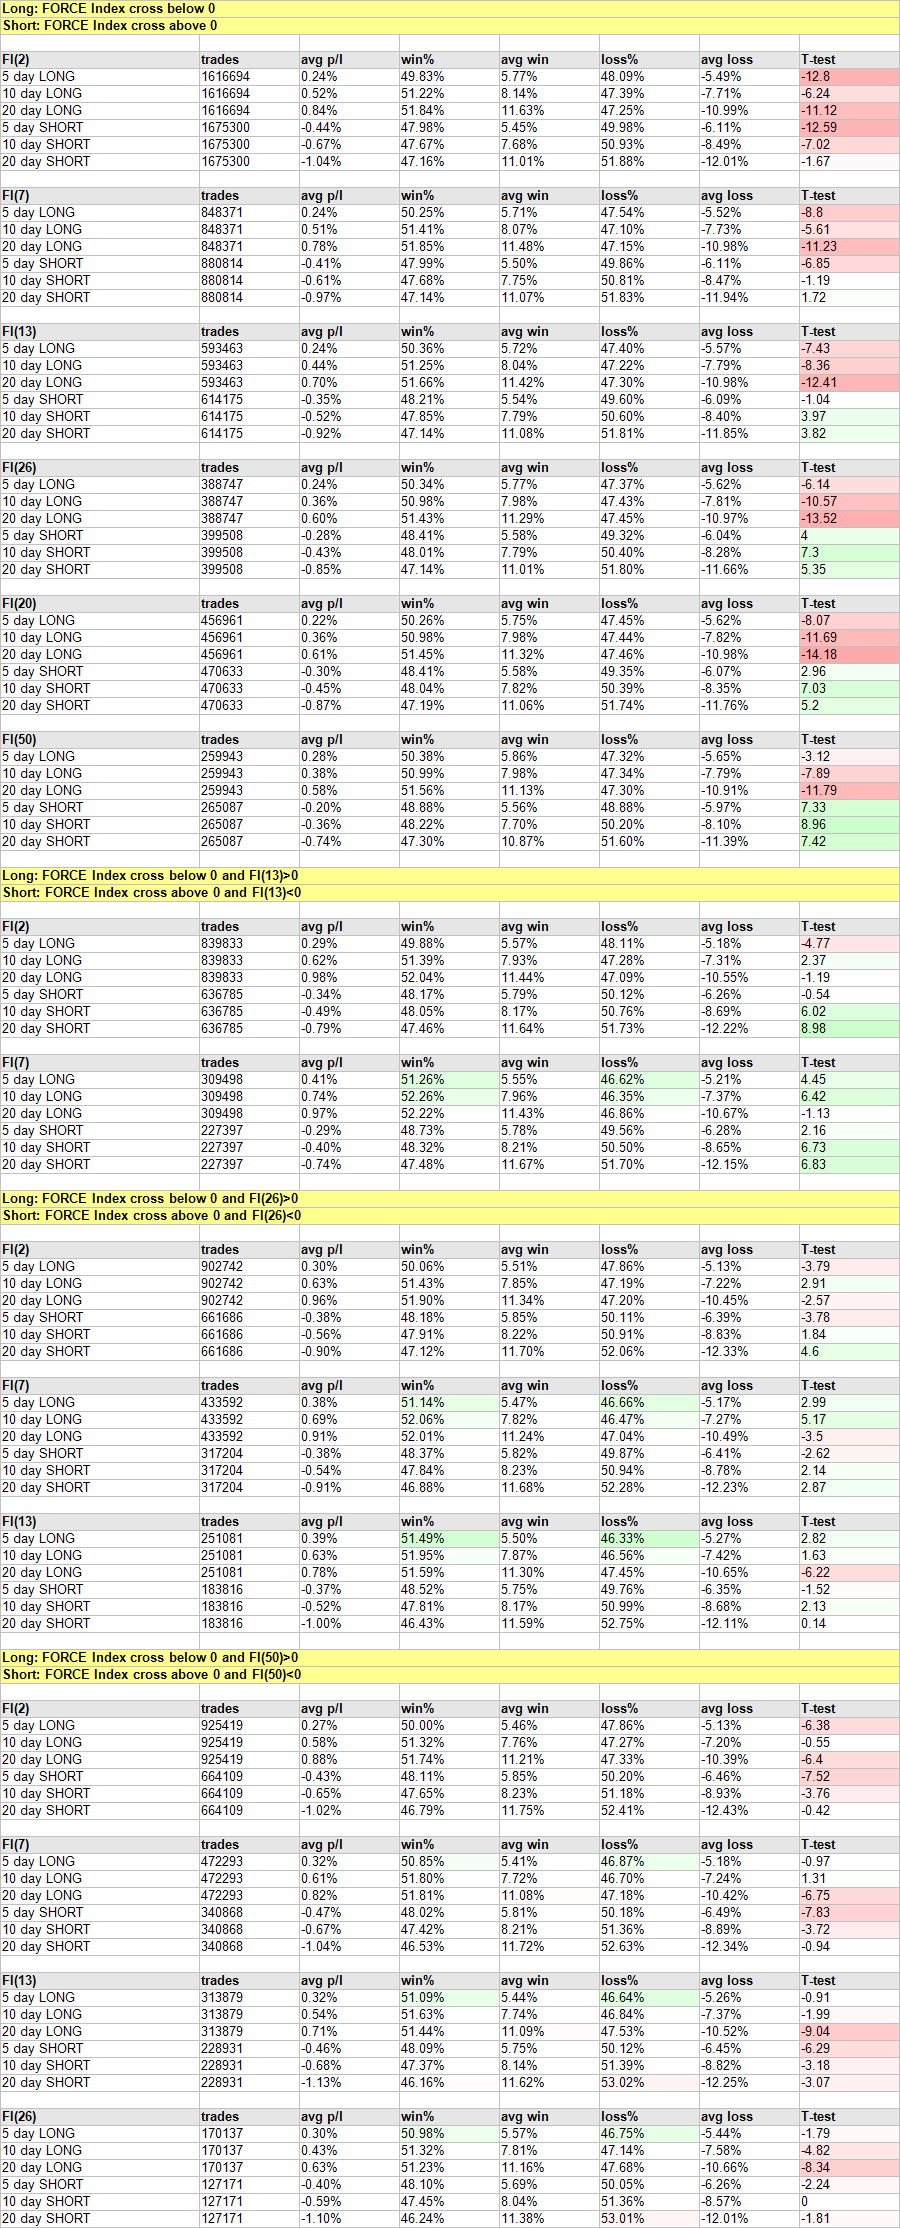
Force Index
In most cases it is even less successful than random trading.
Bollinger Bands
It beats the benchmark in buy and hold for 5 days with the setting (50, 3). In other cases, the results are comparable to random trading.
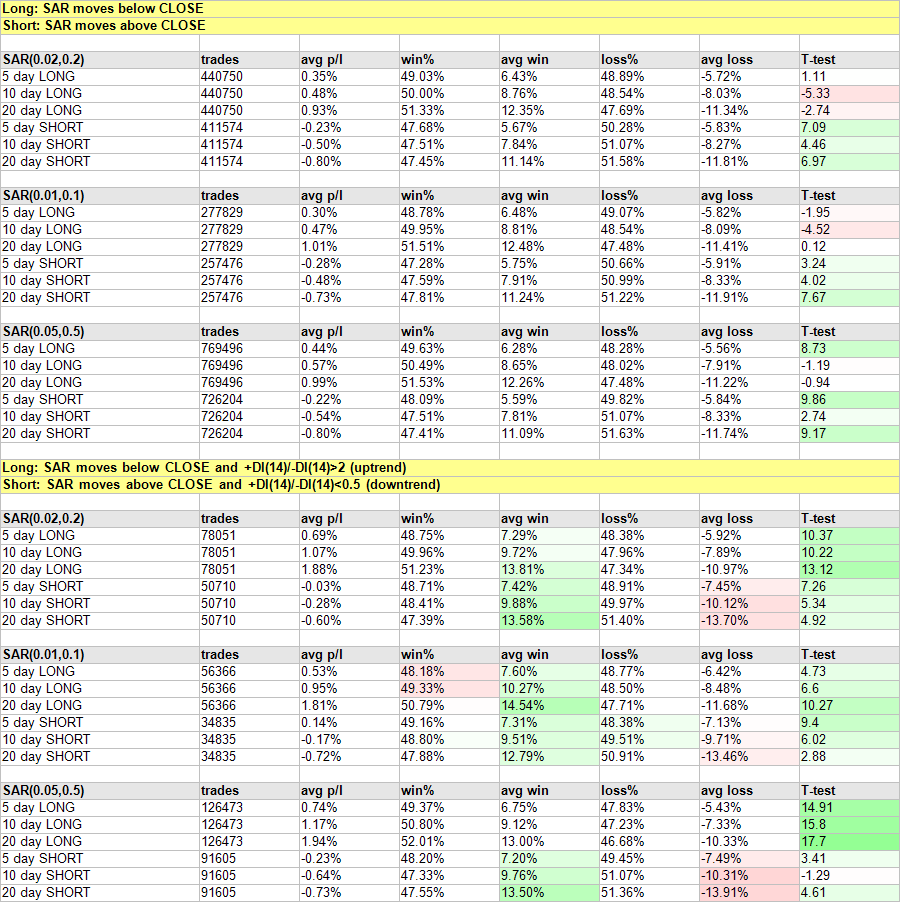
Parabolic SAR
This indicator generally yields very poor results. Yet, with the settings (0.02,0.2) and (0.05,0.5) combined with ADX, it beats the benchmark for long positions. However, in this case the use ADX can be responsible for this favorable result.
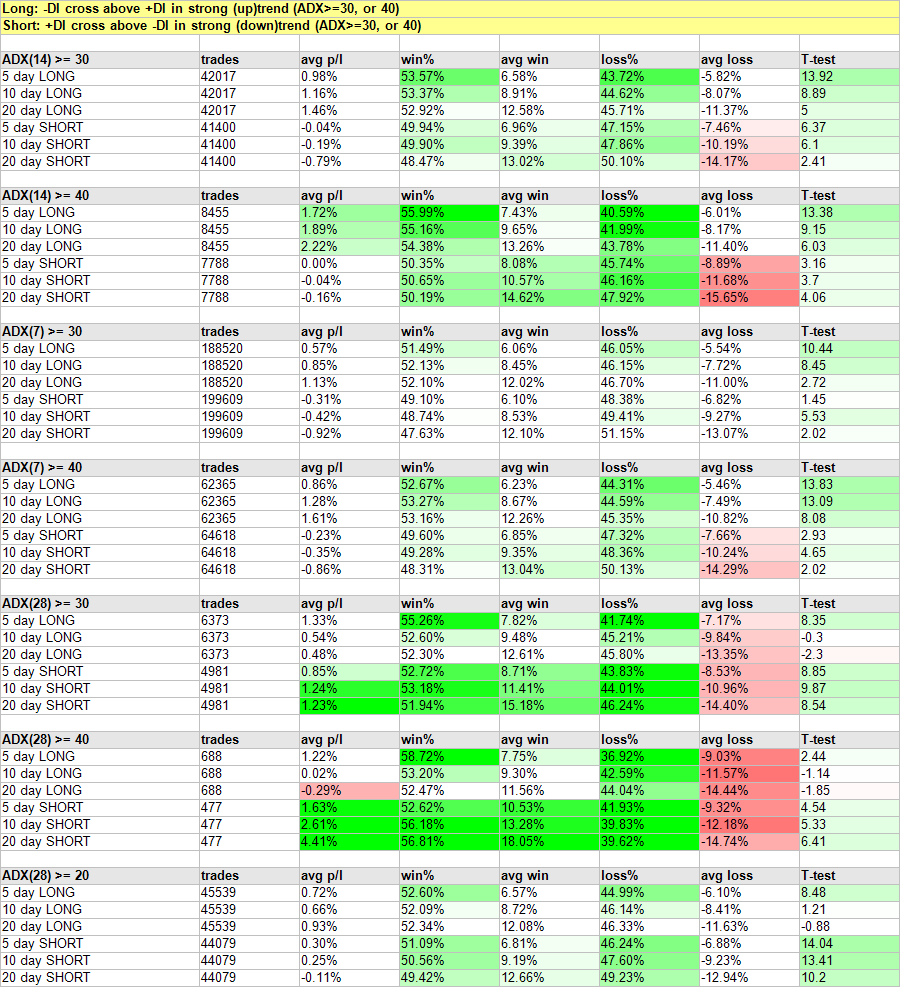
Average Directional Movement (ADX)
With the setting ADX(14) >= 40 it is highly successful for the long positions.