 |
| Market Cap | 911.02M | EPS (ttm) | 3.26 |
| P/E | 12.21 | EPS this Y | -67.45% |
| Forward P/E | 8.00 | EPS next Y | 74.47% |
| PEG | - | EPS past 5Y | - |
| P/S | 0.09 | EPS next 5Y | - |
| P/B | 1.56 | EPS Q/Q | -85.56% |
| Dividend | 2.01% | Sales Q/Q | 13.42% |
| Insider Own | 23.22% | Inst Own | 65.72% |
| Insider Trans | -3.01% | Inst Trans | -3.94% |
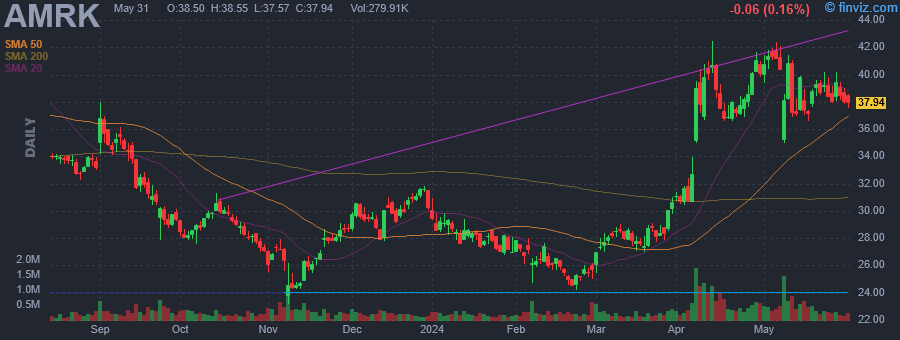
| Short Float | 23.40% | Earnings | May 07/a |
| Analyst Recom | 1.50 | Target Price | 38.75 |
| Avg Volume | 451.61K | 52W Range | 23.14 - 42.48 |
|
|
|
|
A-Mark Precious Metals, Inc. engages in the trading of gold, silver, platinum, and palladium bullion numismatic coins, and related products. It operates through the following segments: Wholesale Trading and Ancillary Services, Direct-to-Consumer, and Secured Lending. The Wholesale Trading and Ancillary Services segment is involved in the distribution and purchasing of metal products from sovereign and private mints. The Direct-to-Consumer segment provides access to a multitude of products through its wholly owned subsidiaries. The Secured Lending segment includes coin and precious metal dealers, investors, and collectors. The company was founded by Steven C. Markoff on April 9, 1965 and is headquartered in El Segundo, CA. |
| Insider Trading |
Relationship |
Date |
Transaction |
Cost |
#Shares |
Value ($) |
#Shares Total |
SEC Form 4 |
| Wittmeyer Michael R. | Director | May 13 '24 | Sale | 37.63 | 18,448 | 694,278 | 329,502 | May 14 04:56 PM | | ROBERTS GREGORY N | Chief Executive Officer | May 10 '24 | Option Exercise | 8.40 | 10,000 | 84,000 | 38,202 | May 13 11:55 AM | | Wittmeyer Michael R. | Director | May 10 '24 | Sale | 38.15 | 44,585 | 1,700,848 | 350,432 | May 13 03:46 PM | | ROBERTS GREGORY N | Chief Executive Officer | May 10 '24 | Sale | 38.53 | 10,000 | 385,335 | 28,202 | May 13 11:55 AM | | John Moorhead | Director | May 10 '24 | Sale | 38.46 | 2,500 | 96,150 | 28,768 | May 14 12:19 PM |
|
|
 |
 |
| Market Cap | 20.02B | EPS (ttm) | 2.62 |
| P/E | 28.44 | EPS this Y | 6.20% |
| Forward P/E | 24.28 | EPS next Y | 7.15% |
| PEG | 3.98 | EPS past 5Y | -6.36% |
| P/S | 2.99 | EPS next 5Y | 7.15% |
| P/B | 3.83 | EPS Q/Q | 19.41% |
| Dividend | 2.25% | Sales Q/Q | 2.38% |
| Insider Own | 6.39% | Inst Own | 82.87% |
| Insider Trans | -0.21% | Inst Trans | 1.62% |
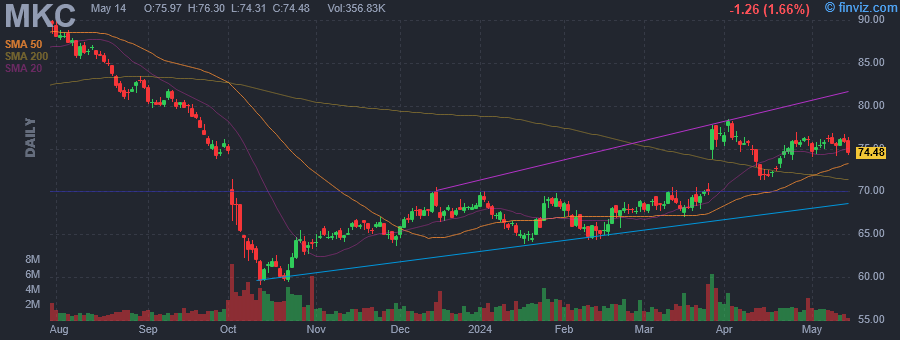
| Short Float | 1.91% | Earnings | Mar 26/b |
| Analyst Recom | 2.94 | Target Price | 76.78 |
| Avg Volume | 1.91M | 52W Range | 59.13 - 94.39 |
|
|
|
|
McCormick & Co., Inc. engages in the manufacturing, marketing, and distribution of spices, seasoning mixes, condiments, and other flavorful products to retail outlets, food manufacturers, and foodservice businesses. It operates through the Consumer and Flavor Solutions segments. The Consumer segment sells spices, seasonings, condiments, and sauces. The Flavor Solutions segment includes seasoning blends, spices and herbs, condiments, coating systems, and compound flavors. The company was founded by Willoughby M. McCormick in 1889 and is headquartered in Baltimore, MD. |
| Insider Trading |
Relationship |
Date |
Transaction |
Cost |
#Shares |
Value ($) |
#Shares Total |
SEC Form 4 |
| Jenkins Katherine | Chief Growth Officer | May 14 '24 | Sale | 75.91 | 2,732 | 207,390 | 0 | May 14 04:53 PM | | Jenkins Katherine | Chief Growth Officer | Apr 22 '24 | Sale | 74.35 | 1,726 | 128,326 | 0 | Apr 23 05:15 PM | | LITTLE PATRICIA A | Director | Apr 01 '24 | Option Exercise | 44.05 | 20,000 | 881,050 | 34,732 | Apr 02 01:18 PM | | LITTLE PATRICIA A | Director | Apr 01 '24 | Sale | 75.57 | 20,000 | 1,511,445 | 24,732 | Apr 02 01:18 PM | | Montiel Maritza Gomez | Director | Mar 28 '24 | Option Exercise | 49.96 | 7,000 | 349,720 | 12,594 | Mar 29 12:12 PM |
|
|
|
 |
| Market Cap | 1.39B | EPS (ttm) | -0.55 |
| P/E | - | EPS this Y | -7.21% |
| Forward P/E | - | EPS next Y | 35.75% |
| PEG | - | EPS past 5Y | - |
| P/S | 39.49 | EPS next 5Y | - |
| P/B | 7.57 | EPS Q/Q | -11.39% |
| Dividend | - | Sales Q/Q | -35.87% |
| Insider Own | 94.80% | Inst Own | 0.88% |
| Insider Trans | -0.01% | Inst Trans | -98.27% |
| Short Float | 7.09% | Earnings | Apr 25/b |
| Analyst Recom | 3.00 | Target Price | 7.25 |
| Avg Volume | 23.20K | 52W Range | 5.71 - 12.50 |
|
|
|
Apr-30-24 12:16PM
|
LiveWire Group, Inc. (NYSE:LVWR) Q1 2024 Earnings Call Transcript
(Insider Monkey) |
|
Apr-25-24 01:00PM
|
Harley-Davidson Stock Plunges as First-Quarter Retail Sales Disappoint
(The Wall Street Journal) |
|
07:00AM
|
LiveWire Group, Inc. Reports 2024 First Quarter Financial Results
(Business Wire) |
|
Apr-04-24 04:00PM
|
LiveWire Group, Inc. To Report First Quarter 2024 Results on April 25, 2024
(Business Wire) |
|
Mar-21-24 12:00PM
|
LiveWire® Announces All-New S2 Mulholland Electric Performance Cruiser
(Business Wire) |
|
Feb-09-24 11:21AM
|
LiveWire Group, Inc. (NYSE:LVWR) Q4 2023 Earnings Call Transcript
(Insider Monkey) |
|
Feb-08-24 07:00AM
|
LiveWire Group, Inc. Reports 2023 Fourth Quarter and Full Year Financial Results
(Business Wire) |
|
Jan-18-24 04:30PM
|
Livewire Group, Inc. To Report Fourth Quarter and Year-End 2023 Results on February 8, 2024
(Business Wire) |
|
Oct-29-23 03:41PM
|
LiveWire Group, Inc. (NYSE:LVWR) Q3 2023 Earnings Call Transcript
(Insider Monkey) |
|
Oct-26-23 07:00AM
|
LiveWire Group, Inc. Reports Third Quarter Financial Results
(Business Wire) +8.20% |
|
LiveWire Group, Inc. manufactures electric vehicle (EV) motorcycles. The company was founded on December 7, 2021 and headquartered in Milwaukee, WI. |
| Insider Trading |
Relationship |
Date |
Transaction |
Cost |
#Shares |
Value ($) |
#Shares Total |
SEC Form 4 |
| Gruner Kjell | Director | May 13 '24 | Sale | 6.67 | 5,000 | 33,345 | 57,808 | May 14 04:52 PM | | Gruner Kjell | Director | May 10 '24 | Sale | 6.73 | 5,000 | 33,637 | 62,808 | May 14 04:52 PM | | Gruner Kjell | Director | May 09 '24 | Sale | 6.67 | 5,000 | 33,335 | 67,808 | May 13 08:27 PM |
|
|
| |
 |
| Market Cap | 205.68M | EPS (ttm) | -0.34 |
| P/E | - | EPS this Y | -48.28% |
| Forward P/E | - | EPS next Y | -10.23% |
| PEG | - | EPS past 5Y | 27.24% |
| P/S | - | EPS next 5Y | - |
| P/B | 2.78 | EPS Q/Q | -68.88% |
| Dividend | - | Sales Q/Q | - |
| Insider Own | 33.43% | Inst Own | 40.96% |
| Insider Trans | -0.02% | Inst Trans | 41.99% |
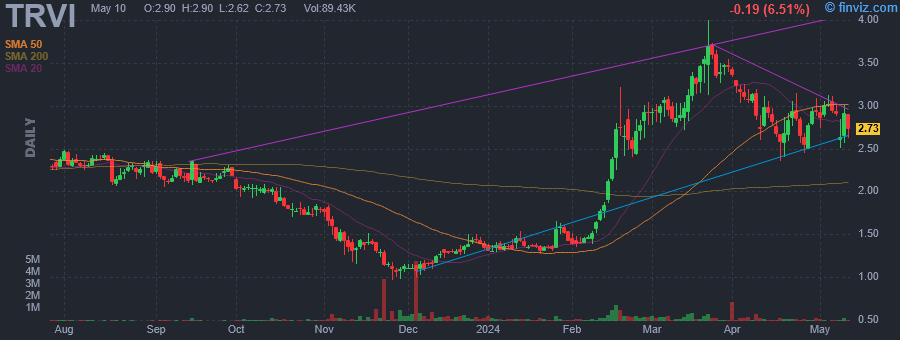
| Short Float | 2.25% | Earnings | May 07/a |
| Analyst Recom | 1.00 | Target Price | 7.40 |
| Avg Volume | 296.93K | 52W Range | 0.97 - 4.00 |
|
|
|
|
Trevi Therapeutics, Inc. is a clinical-stage biopharmaceutical company, which engages in the development and commercialization Haduvio to treat serious neurologically mediated conditions. It includes treatment of chronic pruritus associated with prurigo nodularis and chronic cough in patients with idiopathic pulmonary fibrosis, and levodopa-induced dyskinesia in patients with Parkinson's disease. The company was founded by Thomas R. Sciascia and Jennifer L. Good in March 2011 and is headquartered in New Haven, CT. |
| Insider Trading |
Relationship |
Date |
Transaction |
Cost |
#Shares |
Value ($) |
#Shares Total |
SEC Form 4 |
| GOOD JENNIFER L | President & CEO | May 10 '24 | Option Exercise | 2.19 | 4,578 | 10,026 | 217,891 | May 14 04:51 PM | | GOOD JENNIFER L | President & CEO | May 10 '24 | Sale | 2.90 | 4,578 | 13,276 | 213,313 | May 14 04:51 PM | | Delfini Lisa | Chief Financial Officer | Oct 11 '23 | Option Exercise | 0.51 | 2,292 | 1,171 | 36,686 | Oct 12 04:00 PM | | Delfini Lisa | Chief Financial Officer | Oct 11 '23 | Sale | 2.02 | 785 | 1,586 | 35,901 | Oct 12 04:00 PM | | Delfini Lisa | Chief Financial Officer | Sep 11 '23 | Option Exercise | 0.51 | 2,291 | 1,171 | 35,105 | Sep 13 04:06 PM |
|
|
|
 |
| Market Cap | 6.59B | EPS (ttm) | 8.84 |
| P/E | 26.21 | EPS this Y | 13.21% |
| Forward P/E | 18.67 | EPS next Y | 6.71% |
| PEG | 1.81 | EPS past 5Y | 37.48% |
| P/S | 2.34 | EPS next 5Y | 14.51% |
| P/B | 9.70 | EPS Q/Q | 13.02% |
| Dividend | 1.05% | Sales Q/Q | 5.09% |
| Insider Own | 16.61% | Inst Own | 88.55% |
| Insider Trans | -2.55% | Inst Trans | -2.19% |
| Short Float | 4.91% | Earnings | May 09/b |
| Analyst Recom | 2.00 | Target Price | 253.36 |
| Avg Volume | 283.13K | 52W Range | 102.82 - 263.76 |
|
|
|
|
Installed Building Products, Inc. engages in the business of installing insulation for the residential new construction market. Its products include garage doors, rain gutters, shower doors, closet shelving, and mirrors. The company was founded in 1977 and is headquartered in Columbus, OH. |
| Insider Trading |
Relationship |
Date |
Transaction |
Cost |
#Shares |
Value ($) |
#Shares Total |
SEC Form 4 |
| Niswonger Jason R | Chief Admin & Sustainability | May 13 '24 | Sale | 229.84 | 6,000 | 1,379,046 | 13,159 | May 14 04:50 PM | | FRY TODD R | Chief Accounting Officer | Mar 11 '24 | Sale | 233.50 | 500 | 116,750 | 7,176 | Mar 12 05:00 PM | | Wheeler Brad A | Chief Operating Officer | Mar 08 '24 | Sale | 244.22 | 1,119 | 273,282 | 6,679 | Mar 08 05:30 PM | | Edwards Jeffrey W. | President, CEO and Chairman | Mar 06 '24 | Sale | 235.77 | 48,250 | 11,375,772 | 1,416,194 | Mar 07 05:00 PM | | Edwards Jeffrey W. | President, CEO and Chairman | Mar 05 '24 | Sale | 238.71 | 51,750 | 12,353,216 | 1,464,444 | Mar 07 05:00 PM |
|
|
| |
 |
| Market Cap | 2.02B | EPS (ttm) | 4.89 |
| P/E | 12.12 | EPS this Y | -14.30% |
| Forward P/E | 9.47 | EPS next Y | 7.19% |
| PEG | 0.79 | EPS past 5Y | 32.81% |
| P/S | 0.14 | EPS next 5Y | 15.30% |
| P/B | 2.22 | EPS Q/Q | -6.91% |
| Dividend | 2.01% | Sales Q/Q | -3.07% |
| Insider Own | 62.75% | Inst Own | 45.55% |
| Insider Trans | -0.63% | Inst Trans | -4.87% |
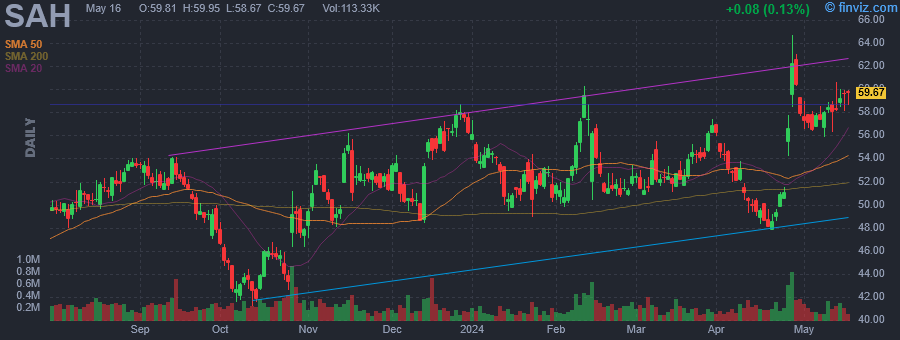
| Short Float | 16.87% | Earnings | Apr 25/b |
| Analyst Recom | 3.38 | Target Price | 55.80 |
| Avg Volume | 242.98K | 52W Range | 39.02 - 64.68 |
|
|
|
|
Sonic Automotive, Inc. operates as a automotive retailer. Its services include sales of both new and used cars and light trucks, sales of replacement parts and performance of vehicle maintenance, warranty, paint and repair services and arrangement of extended service contracts, financing, insurance, vehicle protection products and other aftermarket products for automotive customers. The firm operates through the following segments: Franchised Dealerships and EchoPark. The Franchised Dealerships segment provides comprehensive services, which include sales of both new and used cars and light trucks, sales of replacement parts and performance of vehicle maintenance, manufacturer warranty repairs, and paint and collision repair services. The EchoPark segment sales used cars and light trucks. The company was founded by Ollen Bruton Smith and Bryan Scott Smith in January 1997 and is headquartered in Charlotte, NC. |
| Insider Trading |
Relationship |
Date |
Transaction |
Cost |
#Shares |
Value ($) |
#Shares Total |
SEC Form 4 |
| SMITH DAVID BRUTON | Chairman and CEO | May 14 '24 | Option Exercise | 16.76 | 41,770 | 700,065 | 624,824 | May 14 04:50 PM | | SMITH DAVID BRUTON | Chairman and CEO | May 14 '24 | Sale | 59.27 | 41,770 | 2,475,629 | 583,054 | May 14 04:50 PM | | SMITH DAVID BRUTON | Chairman and CEO | May 13 '24 | Option Exercise | 16.76 | 20,653 | 346,144 | 603,707 | May 14 04:50 PM | | SMITH DAVID BRUTON | Chairman and CEO | May 13 '24 | Sale | 59.26 | 20,653 | 1,223,961 | 583,054 | May 14 04:50 PM | | SMITH DAVID BRUTON | Chairman and CEO | May 10 '24 | Option Exercise | 16.76 | 1,747 | 29,280 | 584,801 | May 14 04:50 PM |
|
|
|
 |
| Market Cap | 11.99B | EPS (ttm) | 8.61 |
| P/E | 27.04 | EPS this Y | 3.35% |
| Forward P/E | 18.77 | EPS next Y | 12.47% |
| PEG | 2.87 | EPS past 5Y | 14.84% |
| P/S | 2.92 | EPS next 5Y | 9.41% |
| P/B | 3.29 | EPS Q/Q | -29.82% |
| Dividend | - | Sales Q/Q | -1.73% |
| Insider Own | 2.04% | Inst Own | 100.96% |
| Insider Trans | -2.32% | Inst Trans | 3.21% |
| Short Float | 3.76% | Earnings | May 09/b |
| Analyst Recom | 1.94 | Target Price | 263.40 |
| Avg Volume | 545.59K | 52W Range | 161.65 - 275.00 |
|
|
|
|
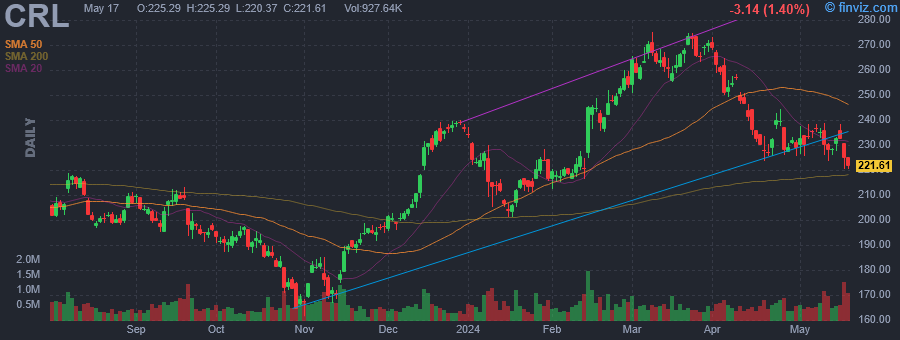
Charles River Laboratories International, Inc. engages in providing products and services to help pharmaceutical and biotechnology companies. It operates through the following segments: Research Models and Services (RMS), Discovery and Safety Assessment (DSA), and Manufacturing Solutions. The RMS segment includes its insourcing solutions business and Charles River accelerator and development lab footprint. The DSA segment offers regulatory-required safety testing of potential new drugs, vaccines, industrial and agricultural chemicals, consumer products, veterinary medicines, and medical devices. The Manufacturing Solutions segment focuses on microbial solutions and biologics solutions. The company was founded by Henry L. Foster in 1947 and is headquartered in Wilmington, MA. |
| Insider Trading |
Relationship |
Date |
Transaction |
Cost |
#Shares |
Value ($) |
#Shares Total |
SEC Form 4 |
| LaPlume Joseph W | EVP, Corp Strategy & Develop | May 10 '24 | Sale | 226.97 | 1,304 | 295,969 | 23,276 | May 14 04:49 PM | | Knell Michael Gunnar | CSVP&Chief Accounting Officer | Mar 08 '24 | Sale | 267.52 | 808 | 216,156 | 7,024 | Mar 11 04:42 PM | | Knell Michael Gunnar | CSVP&Chief Accounting Officer | Mar 04 '24 | Sale | 261.05 | 2,750 | 717,890 | 7,832 | Mar 05 04:54 PM | | Creamer Victoria L | EVP & Chief People Officer | Feb 29 '24 | Sale | 253.70 | 5,000 | 1,268,500 | 13,550 | Mar 01 05:37 PM | | Parisotto Shannon M | CEVP, Disc & Safety Assessment | Feb 29 '24 | Sale | 253.45 | 3,786 | 959,545 | 4,792 | Mar 04 04:09 PM |
|
|
| |
 |
| Market Cap | 589.51M | EPS (ttm) | -1.12 |
| P/E | - | EPS this Y | 46.85% |
| Forward P/E | 14.81 | EPS next Y | 21.06% |
| PEG | - | EPS past 5Y | - |
| P/S | 0.93 | EPS next 5Y | 26.80% |
| P/B | 1.98 | EPS Q/Q | -382.41% |
| Dividend | - | Sales Q/Q | 24.08% |
| Insider Own | 11.69% | Inst Own | 69.12% |
| Insider Trans | -3.49% | Inst Trans | -4.12% |
| Short Float | 5.06% | Earnings | May 07/b |
| Analyst Recom | 2.00 | Target Price | 28.43 |
| Avg Volume | 404.08K | 52W Range | 9.34 - 25.02 |
|
|
|
|
Bandwidth, Inc. engages in the provision of cloud communications software services. The firm is also involved in delivering experiences through voice calling, text messaging, and emergency services applications. The company was founded by Henry Kaestner and David A. Morken in July 2000 and is headquartered in Raleigh, NC. |
| Insider Trading |
Relationship |
Date |
Transaction |
Cost |
#Shares |
Value ($) |
#Shares Total |
SEC Form 4 |
| Ross Kade | Chief Information Officer | May 14 '24 | Sale | 22.15 | 68 | 1,506 | 25,529 | May 14 04:48 PM | | Ross Kade | Chief Information Officer | May 12 '24 | Option Exercise | 0.00 | 232 | 0 | 25,597 | May 14 04:48 PM | | Krupka Devin M | Controller, PAO | May 10 '24 | Sale | 21.61 | 2,500 | 54,012 | 7,262 | May 13 05:29 PM | | Krupka Devin M | Controller, PAO | Apr 15 '24 | Sale | 16.96 | 25 | 424 | 9,762 | Apr 16 04:26 PM | | Krupka Devin M | Controller, PAO | Apr 14 '24 | Option Exercise | 0.00 | 80 | 0 | 9,787 | Apr 16 04:26 PM |
|
|
|
 |
| Market Cap | 21.53B | EPS (ttm) | 13.41 |
| P/E | 29.91 | EPS this Y | 6.56% |
| Forward P/E | 22.89 | EPS next Y | 7.25% |
| PEG | 4.27 | EPS past 5Y | 16.51% |
| P/S | 3.92 | EPS next 5Y | 7.00% |
| P/B | 7.35 | EPS Q/Q | -18.88% |
| Dividend | 1.23% | Sales Q/Q | 8.85% |
| Insider Own | 0.36% | Inst Own | 91.24% |
| Insider Trans | -17.83% | Inst Trans | 1.55% |
| Short Float | 2.43% | Earnings | Apr 30/b |
| Analyst Recom | 2.00 | Target Price | 412.71 |
| Avg Volume | 437.24K | 52W Range | 248.37 - 429.61 |
|
|
|
|
Hubbell, Inc. engages in the designing, manufacturing, and sale of electrical and electronic products for non-residential and residential construction, industrial, and utility applications. It operates through the Electrical Solutions and Utility Solutions segments. The Electrical Solutions segment manufactures and sells wiring and electrical, lighting fixtures, and controls for indoor and outdoor applications as well as specialty lighting and communications products. The Utility Solutions segment is involved in the design, manufacture, and sale of electrical distribution, transmission, substation, and telecommunications products. The company was founded by Harvey Hubbell II in 1888 and is headquartered in Shelton, CT. |
| Insider Trading |
Relationship |
Date |
Transaction |
Cost |
#Shares |
Value ($) |
#Shares Total |
SEC Form 4 |
| FLYNN ALYSSA R | Chief Human Resources Officer | May 10 '24 | Option Exercise | 105.48 | 1,361 | 143,565 | 6,129 | May 14 04:47 PM | | FLYNN ALYSSA R | Chief Human Resources Officer | May 10 '24 | Sale | 406.79 | 1,106 | 449,910 | 4,234 | May 14 04:47 PM | | Keating Neal J | Director | May 03 '24 | Buy | 378.77 | 500 | 189,385 | 8,571 | May 07 04:37 PM | | Dial Debra L. | Director | May 03 '24 | Buy | 377.90 | 150 | 56,685 | 589 | May 07 04:30 PM | | Mikes Mark Eugene | President Electrical Solutions | Feb 12 '24 | Sale | 363.45 | 397 | 144,290 | 4,899 | Feb 13 05:02 PM |
|
|
|
 |
| Market Cap | 7.15B | EPS (ttm) | 2.25 |
| P/E | 18.12 | EPS this Y | 20.14% |
| Forward P/E | 16.72 | EPS next Y | 28.32% |
| PEG | 1.22 | EPS past 5Y | 51.73% |
| P/S | 2.39 | EPS next 5Y | 14.90% |
| P/B | 1.69 | EPS Q/Q | -53.66% |
| Dividend | - | Sales Q/Q | 84.90% |
| Insider Own | 31.96% | Inst Own | 66.45% |
| Insider Trans | -0.09% | Inst Trans | -0.34% |
| Short Float | 3.58% | Earnings | May 01/a |
| Analyst Recom | 1.62 | Target Price | 50.87 |
| Avg Volume | 1.08M | 52W Range | 29.98 - 44.89 |
|
|
|
|
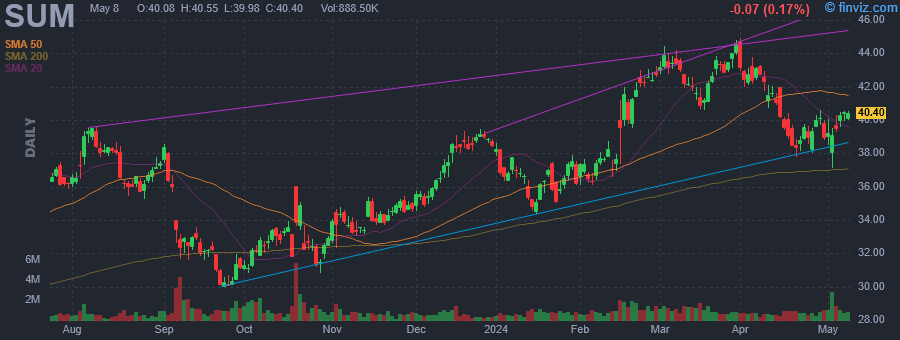
Summit Materials, Inc. is a vertically integrated construction materials company, which engages in manufacturing construction materials and related downstream products. It operates through the following segments: West, East, and Cement. The West segment includes operations in Texas, Utah, Arizona, Colorado, Idaho, Wyoming, Oklahoma, Arkansas and British Columbia, Canada. The East segments refers to its East and Central regions and serves markets extending across the Midwestern and Eastern United States. The Cement segment is involved in Hannibal, Missouri and Davenport, Iowa cement plants, and distribution terminals along the Mississippi River from Minnesota to Louisiana. The company was founded by Thomas W. Hill on September 23, 2014 and is headquartered in Denver, CO. |
| Insider Trading |
Relationship |
Date |
Transaction |
Cost |
#Shares |
Value ($) |
#Shares Total |
SEC Form 4 |
| Kilgore Jason | See Remarks | May 13 '24 | Option Exercise | 18.00 | 50,589 | 910,602 | 111,219 | May 14 04:47 PM | | Kilgore Jason | See Remarks | May 13 '24 | Sale | 40.21 | 50,589 | 2,033,951 | 60,630 | May 14 04:47 PM |
|
|
|
